
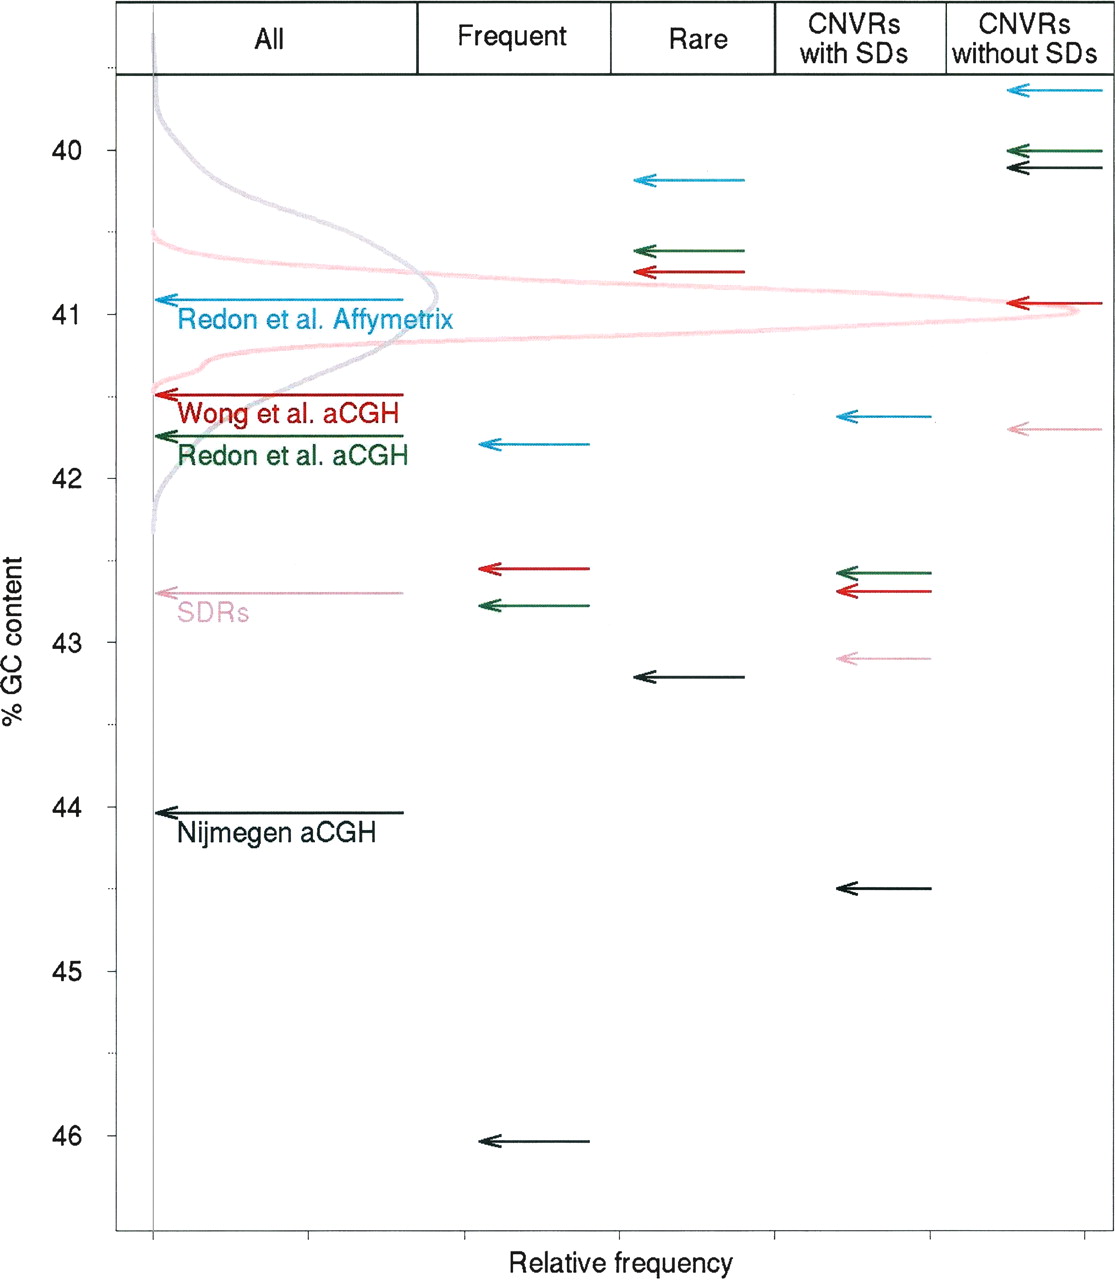
Percentage of G+C contents for CNVRs and SDRs compared with size-matched randomized sets for Nijmegen CNVRs (indicated within black arrows), Redon et al. Affymetrix CNVRs (cyan), Redon et al. aCGH (green), Wong et al. CNVRs (red), and SDRs (pink). The first column shows G+C contents for the entire sets. The G+C contents of CNVR sets partitioned according to frequency are shown in the second and third columns (“Frequent,” CNVRs at >1% observed population frequency; “Rare,” CNVRs at <1% observed population frequency). The fourth and fifth columns show G+C contents of CNVR sets partitioned according to their overlap, or not, with SDs. Additionally, the G+C contents of SDRs overlapped, or not, by CNVs, are shown in the fourth and fifth columns, respectively. The frequency distribution of the G+C contents for 500 randomly sampled sets of genomic regions, matched in size to Nijmegen CNVRs (gray density curve) and to SDRs (pink density curve), are also shown.


