
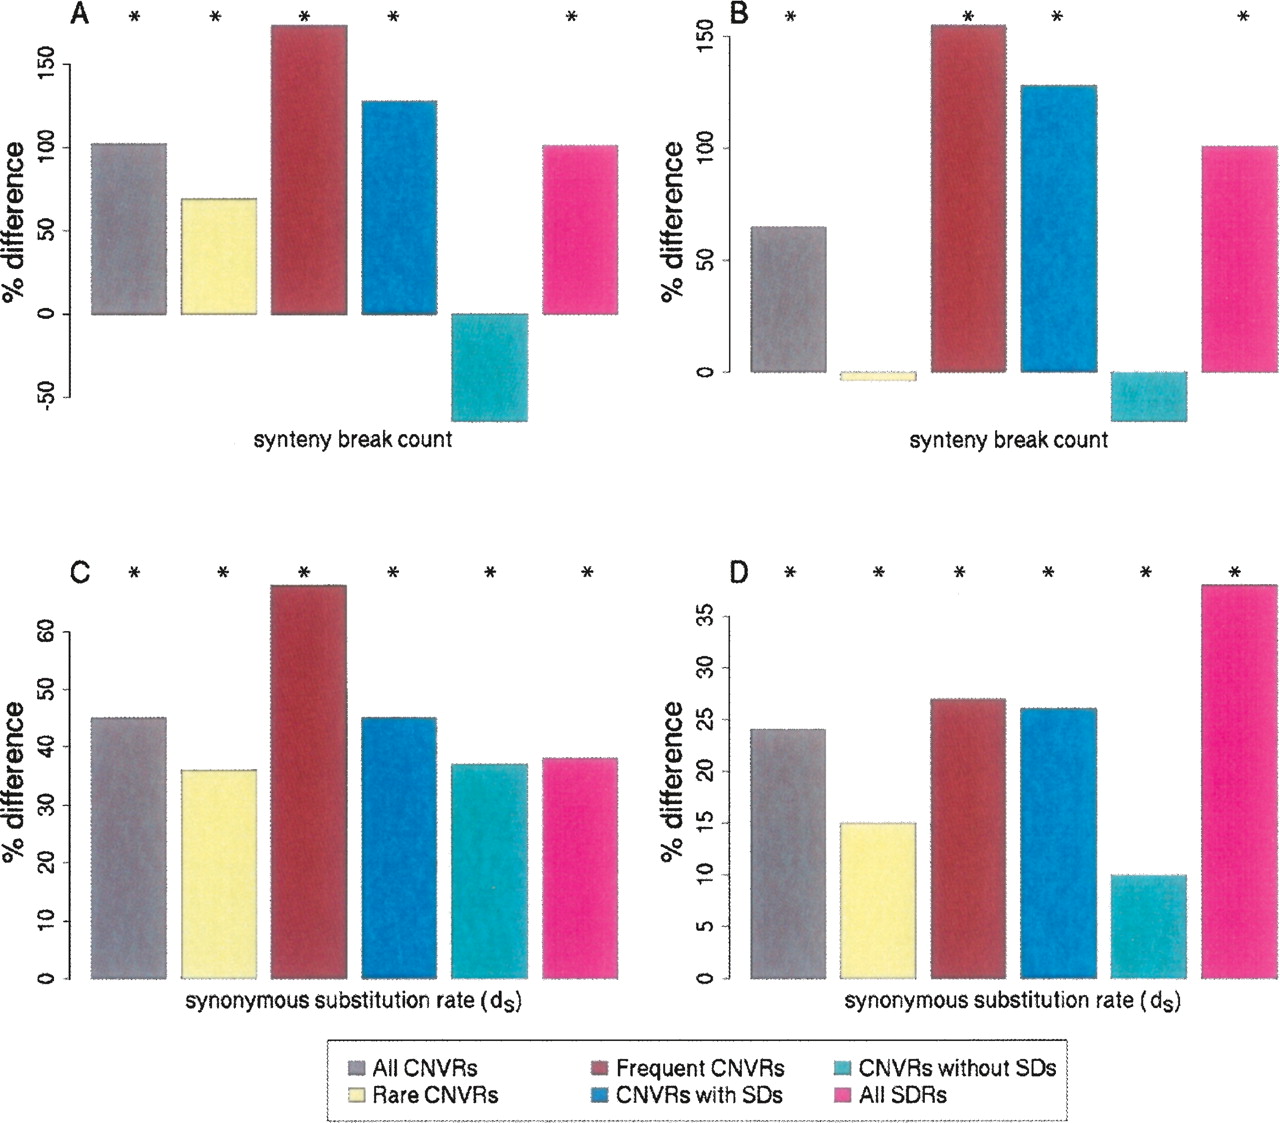
The departures from expected values for the coincidence of CNVRs with human and dog synteny breakpoints (A,B) and human and dog orthologs’ synonymous substitution rates within CNVRs (C,D), calculated for sets of Nijmegen CNVRs and Redon et al. aCGH CNVRs. Results are shown as percentage differences from values expected by random sampling of the human genome reference assembly (see Methods). (A,C) Nijmegen aCGH CNVRs; (B,D) Redon et al. aCGH CNVRs. For either Nijmegen or Redon et al. aCGH data, the set of genomic regions are: “All CNVRs,” all CNV regions; “Rare CNVRs,” genomic regions in which CNVs were identified in <1% of the individuals sampled; “Frequent CNVRs,” CNVRs in which CNVs were identified in >1% of the individuals sampled; “CNVRs with SDs,” CNV regions overlapping with at least one SD; “CNVRs without SDs,” CNV regions having no overlap with SDs; and “All SDRs,” the set of all 8051 SD regions (shown accompanying each CNVR set). Bars annotated with an asterisk (*) are significant at P < 0.025.


