
Rates of copy number fixation and polymorphism by gene functional categories
Click on table to view larger version.
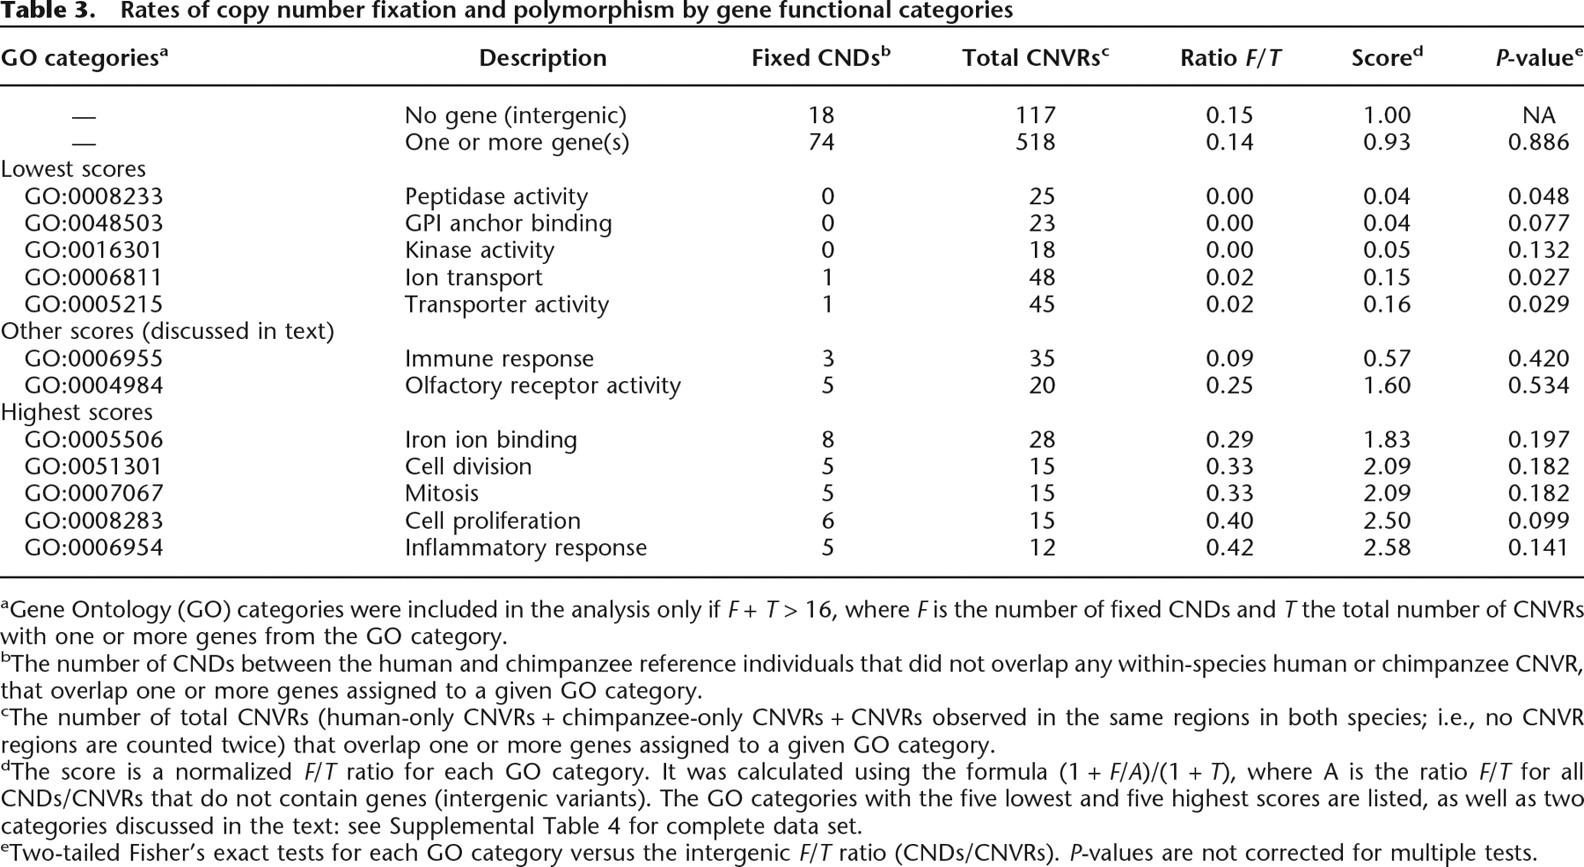
aGene Ontology (GO) categories were included in the analysis only if F + T > 16, where F is the number of fixed CNDs and T the total number of CNVRs with one or more genes from the GO category.
bThe number of CNDs between the human and chimpanzee reference individuals that did not overlap any within-species human or chimpanzee CNVR, that overlap one or more genes assigned to a given GO category.
cThe number of total CNVRs (human-only CNVRs + chimpanzee-only CNVRs + CNVRs observed in the same regions in both species; i.e., no CNVR regions are counted twice) that overlap one or more genes assigned to a given GO category.
dThe score is a normalized F/T ratio for each GO category. It was calculated using the formula (1 + F/A)/(1 + T), where A is the ratio F/T for all CNDs/CNVRs that do not contain genes (intergenic variants). The GO categories with the five lowest and five highest scores are listed, as well as two categories discussed in the text: see Supplemental Table 4 for complete data set.
eTwo-tailed Fisher’s exact tests for each GO category versus the intergenic F/T ratio (CNDs/CNVRs). P-values are not corrected for multiple tests.


