
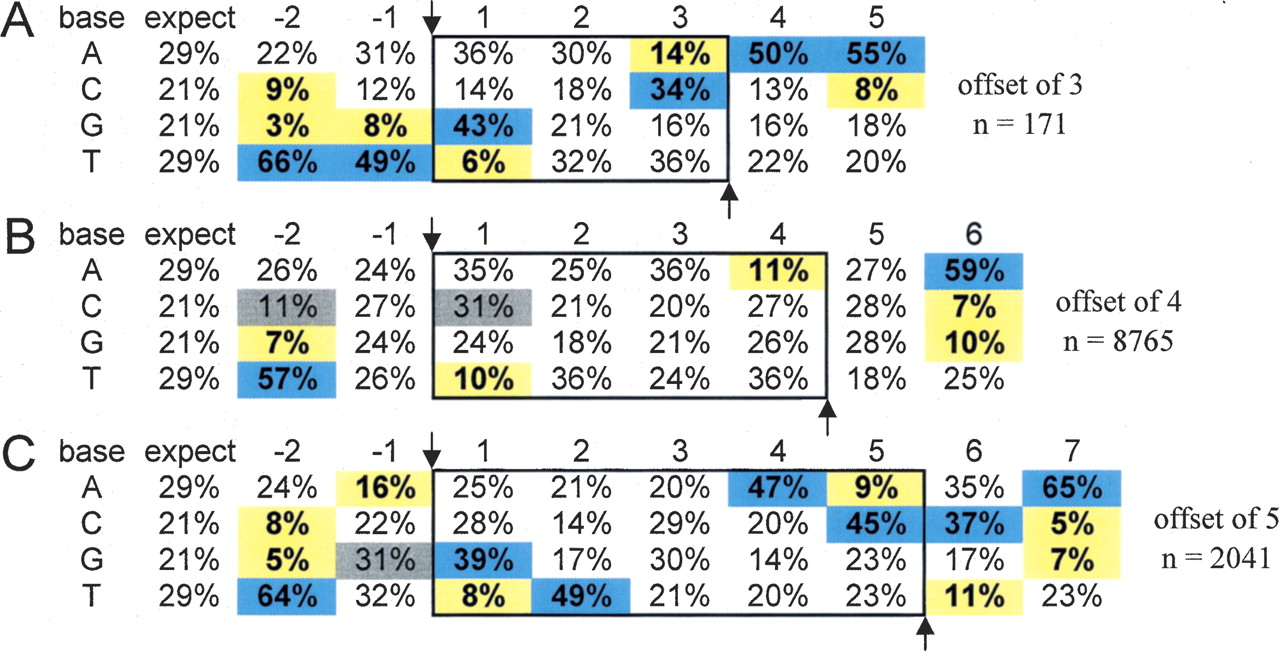
Symmetrical sequence preferences at OmniBankII gene trap insertion sites. (A–C) Base compositions surrounding each gene trap insertion site are shown according to chromosomal cleavage offset. Insertion occurs between position −1 and 1 on the top strand (with respect to the orientation of the retroviral backbone rather than the gene trap construct components). Confirmed duplicated junction sequences are shown within the solid box. (Arrows) Base positions for DNA strand transfer. Positions showing statistically different base frequencies are highlighted. (Gray) Differences of 10%; differences of >10% (blue, increased frequency; or yellow, decreased frequency). Additional discussion and an expanded version of this table can be found in the Supplemental material and Supplemental Figure 7.


