
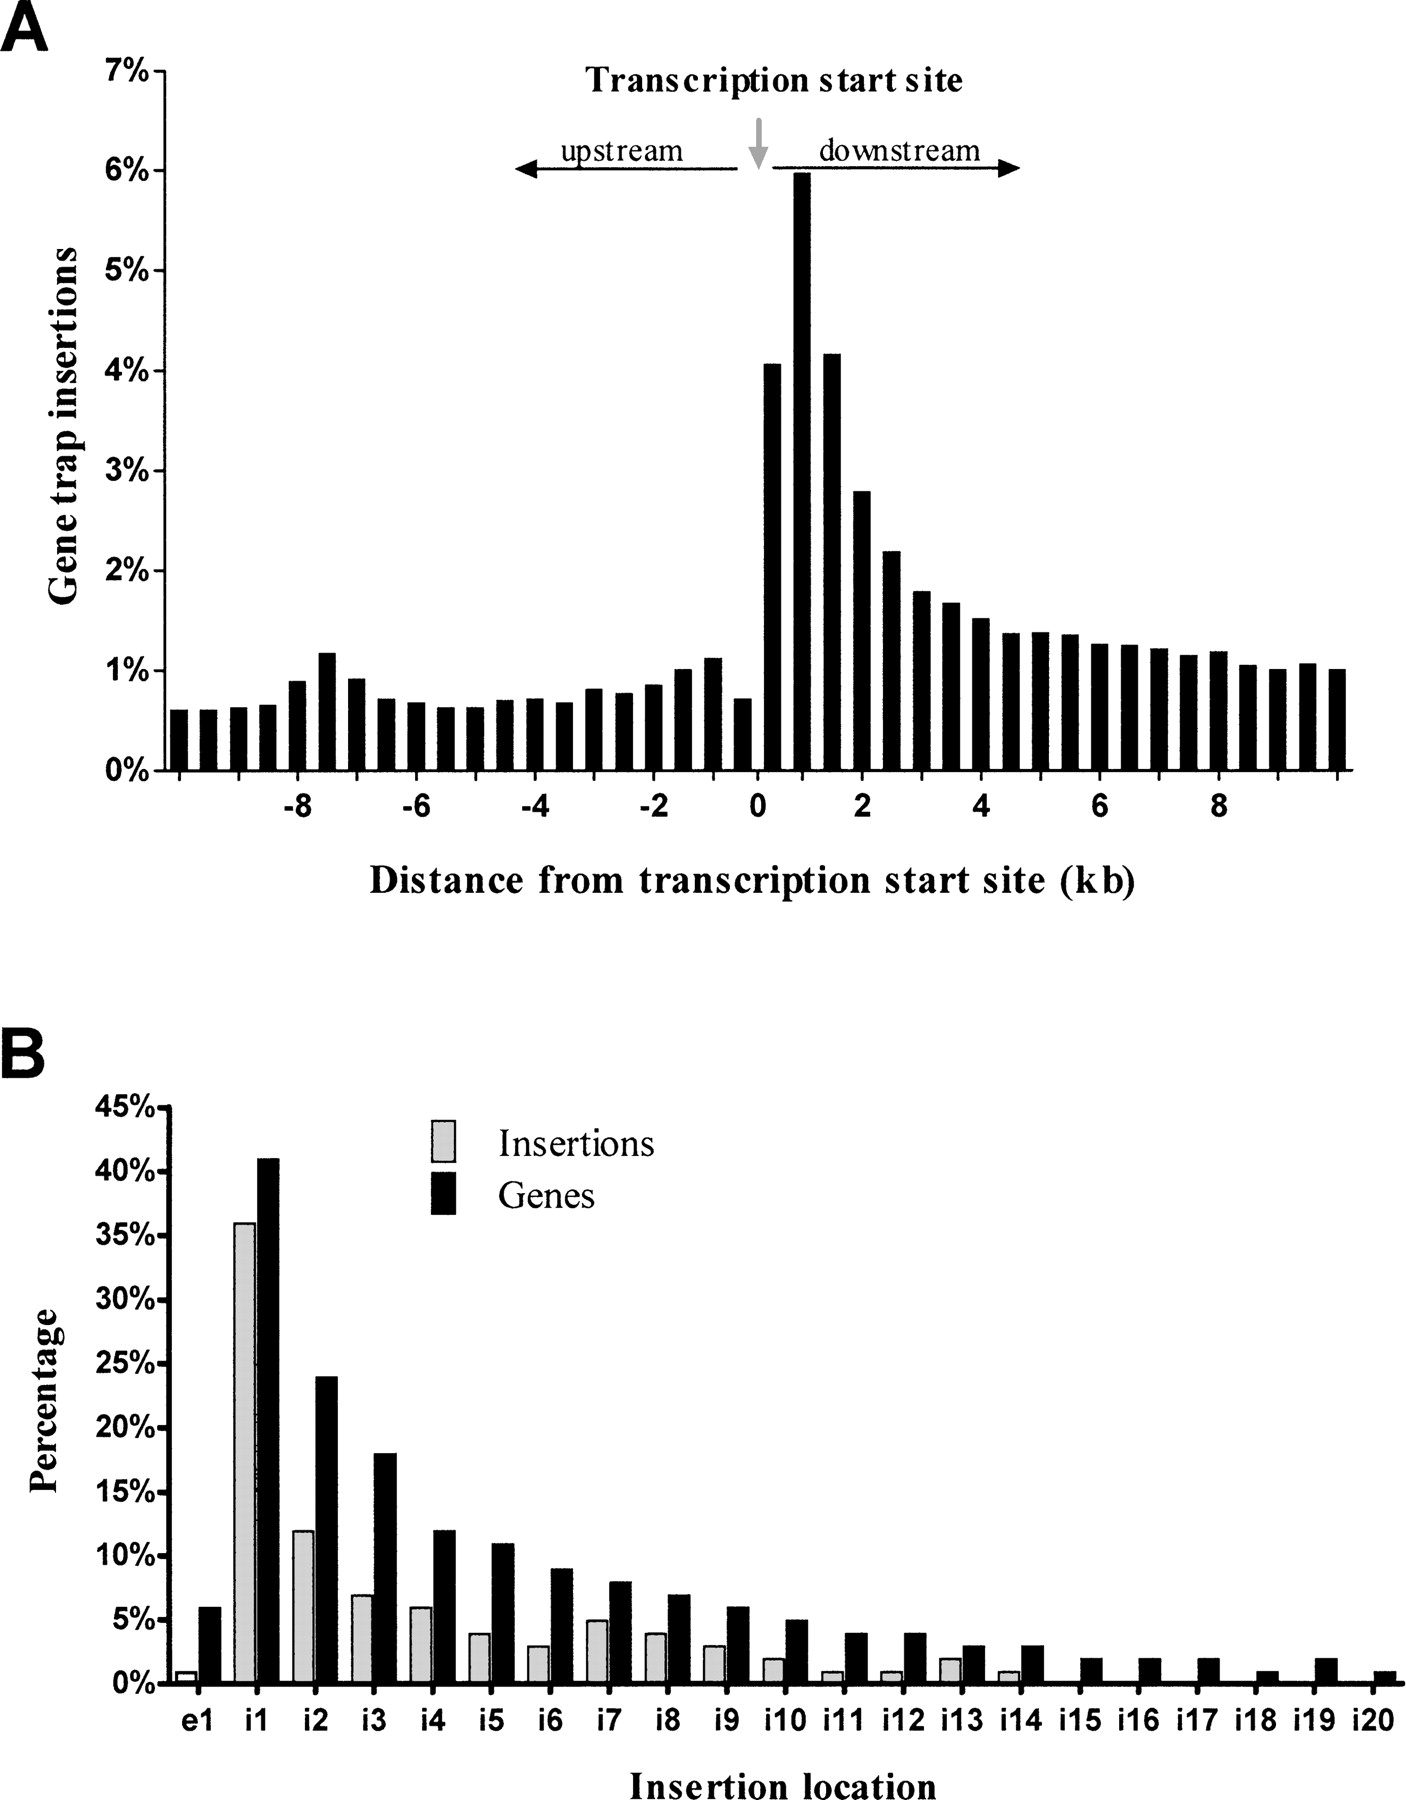
Figure 2.
OmniBankII gene trap insertions show first intron bias. (A) All insertions occurring within 10 kb upstream or downstream of a TSS were identified and used to plot the percentage of insertions occurring within 500-bp intervals on either side of the TSS. (B) Graph showing the percentage of total genic insertions occurring within exon 1 (e1) or introns 1 through 20 (i1–i20). The percentage was calculated as a function of total genic insertions, or as a function of genes containing insertions in each category.


