
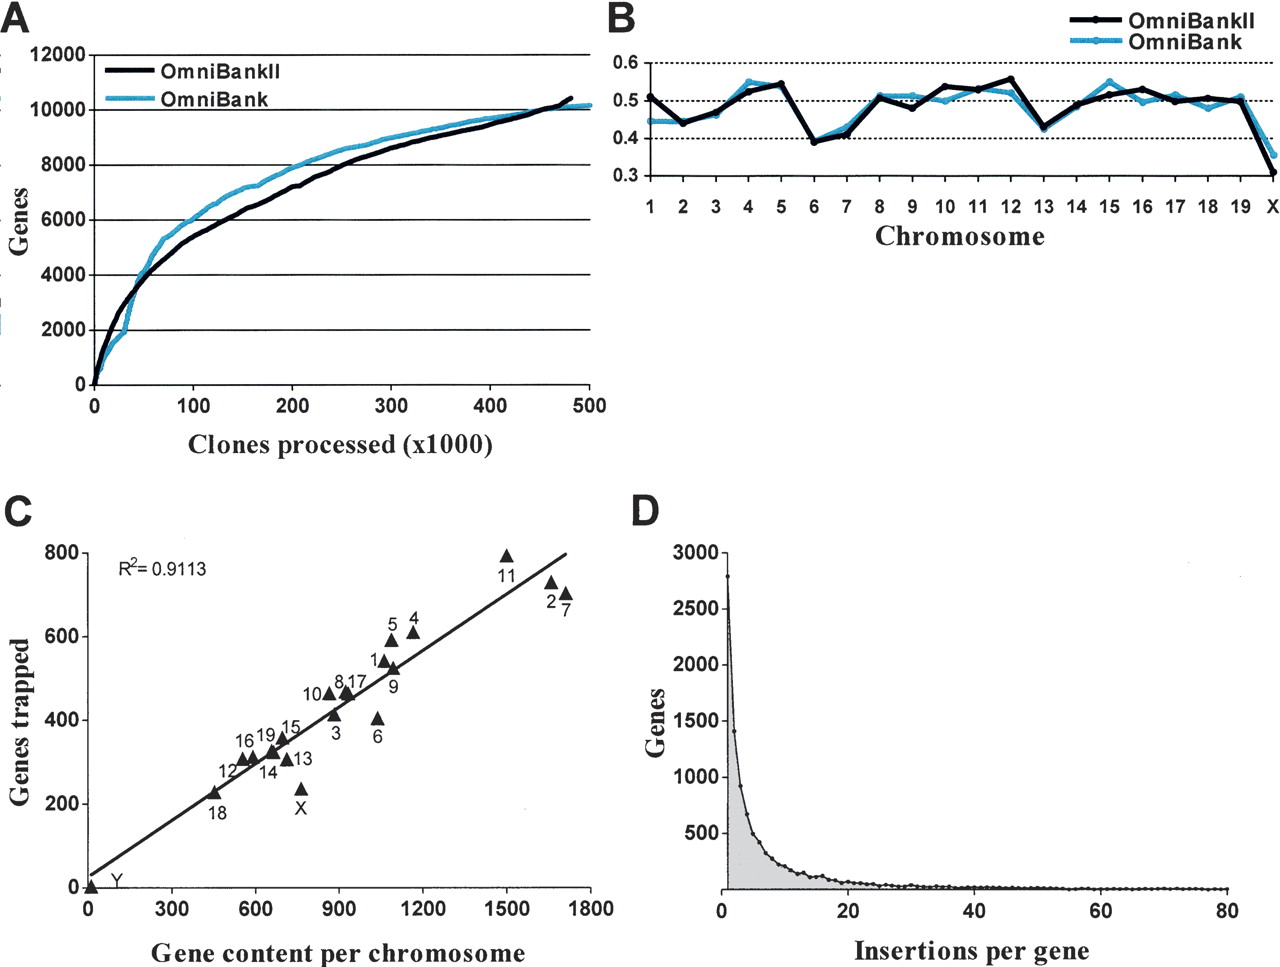
OmniBankII gene acquisition and chromosomal distribution. (A) Gene acquisition rate over the course of OmniBankII production, shown as a function of the number of clones processed for sequence acquisition. For comparison, a plot of OmniBank gene acquisition (Zambrowicz et al. 2003) is shown. (B) Frequency of gene trap acquisition across the mouse genome. Frequency is calculated as a percentage of RefSeq genes trapped in each library. (C) Correlation between chromosomal gene content and gene acquisition for OmniBankII. RefSeq genes mapped to the random contig set were excluded from analysis. (D) Density of gene trap mutations per gene for the OmniBankII library.


