
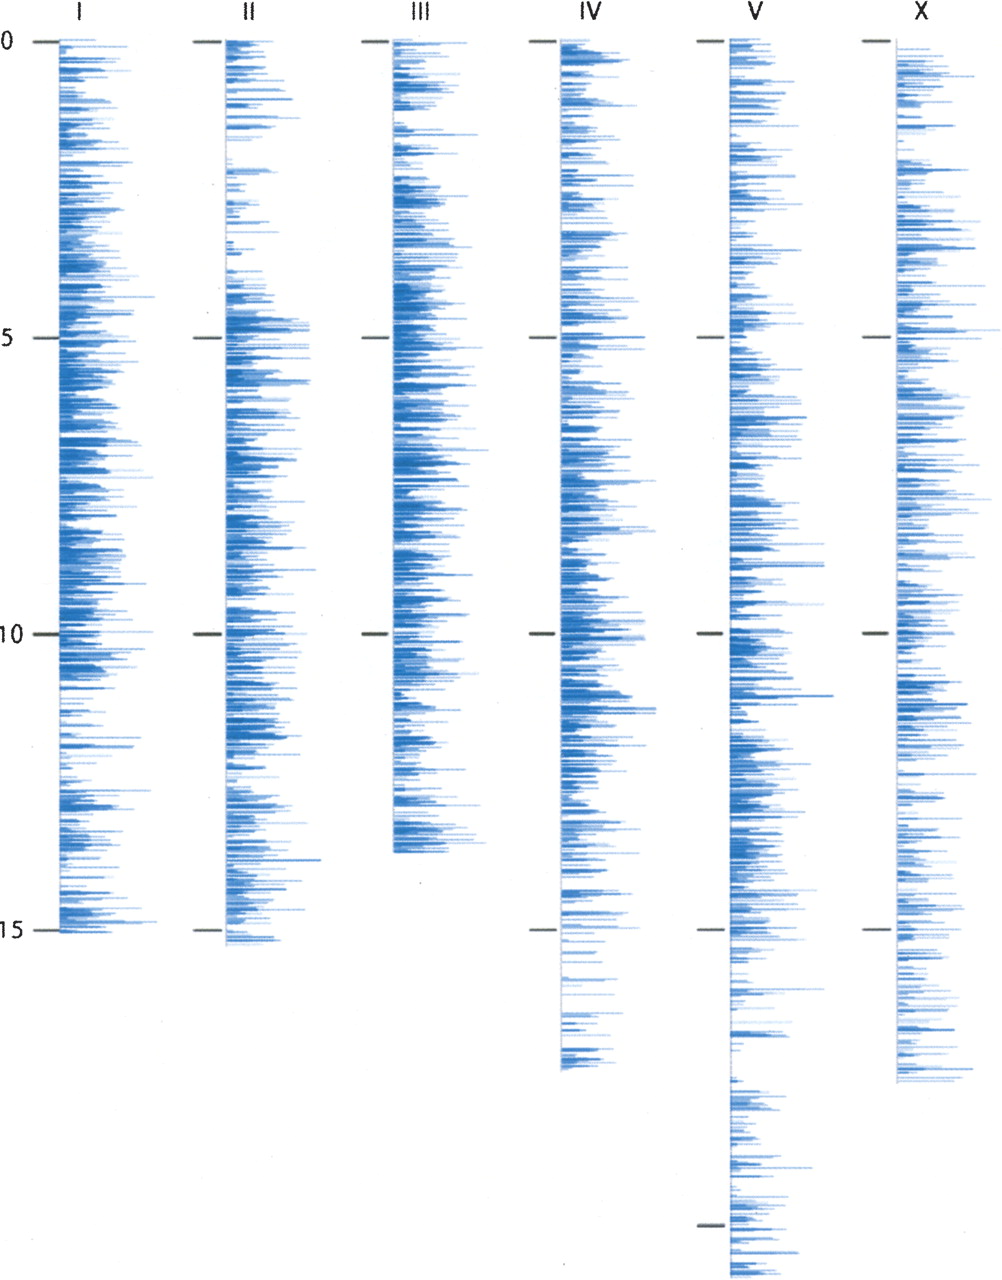
Chromsomal distribution of peptides identified by mass spectrometry in C. elegans. Shown here are the distributions of our mass spectral identifications by chromosome location. The chromosomes are binned into sections of ∼100 kb, and the length of the blue line represents the number of spectra mapping to genes in that bin. This figure shows that our peptides are sampled more frequently from genes in the center of the autosomes and more disperse on the arms of the autosomes and on the sex chromosome. Assuming that peptides are sampled more frequently for abundant proteins, these data support that proteins near the center of the autosome are, on average, expressed at a greater abundance than proteins located on the arms of the autosome.


