
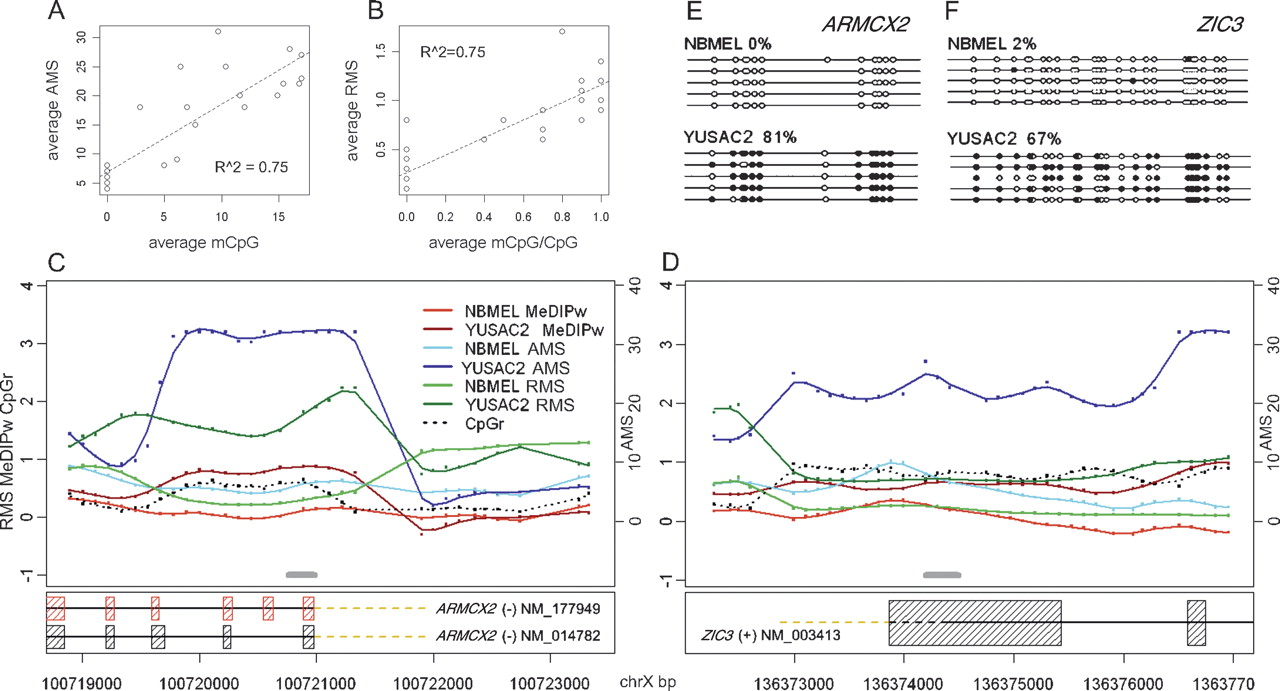
Validation with bisulfite genomic DNA sequencing. Promoter methylation status in 14 genes are determined by bisulfite sequencing and compared with the AMS (A, Y-axis) and RMS (B, Y-axis) on both NBMEL and YUSAC2 samples. AMS and RMS refer here to the average for the probes within the amplicon used for bisulfite genomic DNA sequencing. Weighted MeDIP logR (MeDIPw), absolute (AMS) and relative (RMS) measurement of methylation level in ARMCX2 promoter (C) and ZIC3 promoter (D) are shown. Gray lines indicate the regions analyzed by bisulfite genomic DNA sequencing. CpGr indicates the CpG ratio for each probe (for details, see Methods). Bisulfite sequencing of differentially methylated ARMCX2 promoter (E) and ZIC3 promoter (F) are shown. Each line represents the sequence of a single clone. CpGs are represented as open dots (if unmethylated) or filled dots (if methylated). The percentage of CpG methylation is indicated for each amplicon.


