
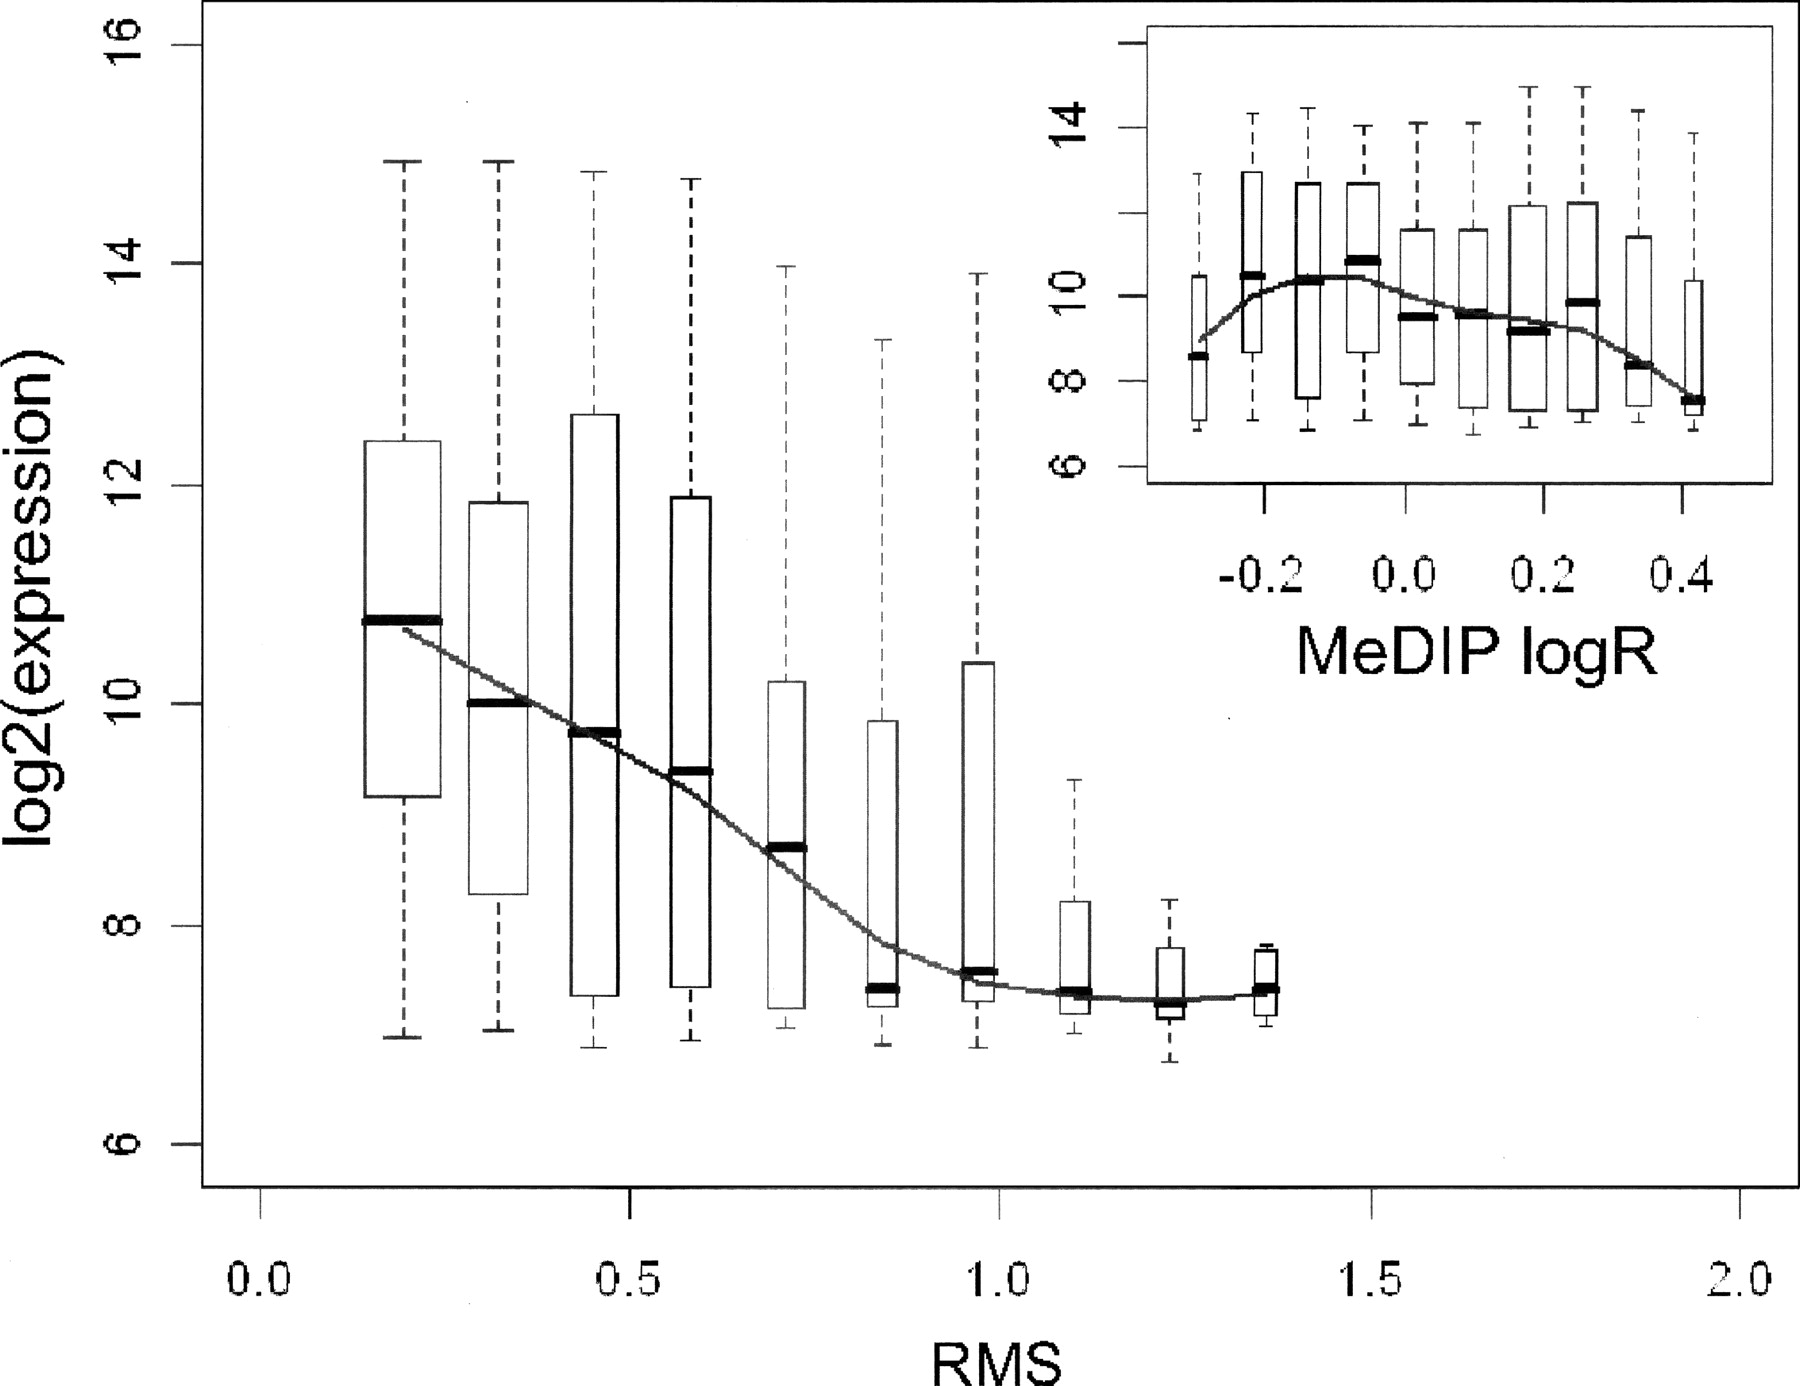
Figure 3.
Association of average NBMEL promoter RMS with gene expression level. For each RMS bin, the gene expression box-and-whisker plot is reported (the box identifying the first, second, and third quartile of the log2 average gene expression). The line represents the trend over the median values. (Inset) Shows the same analysis with the MeDIP logR on the X-axis.


