
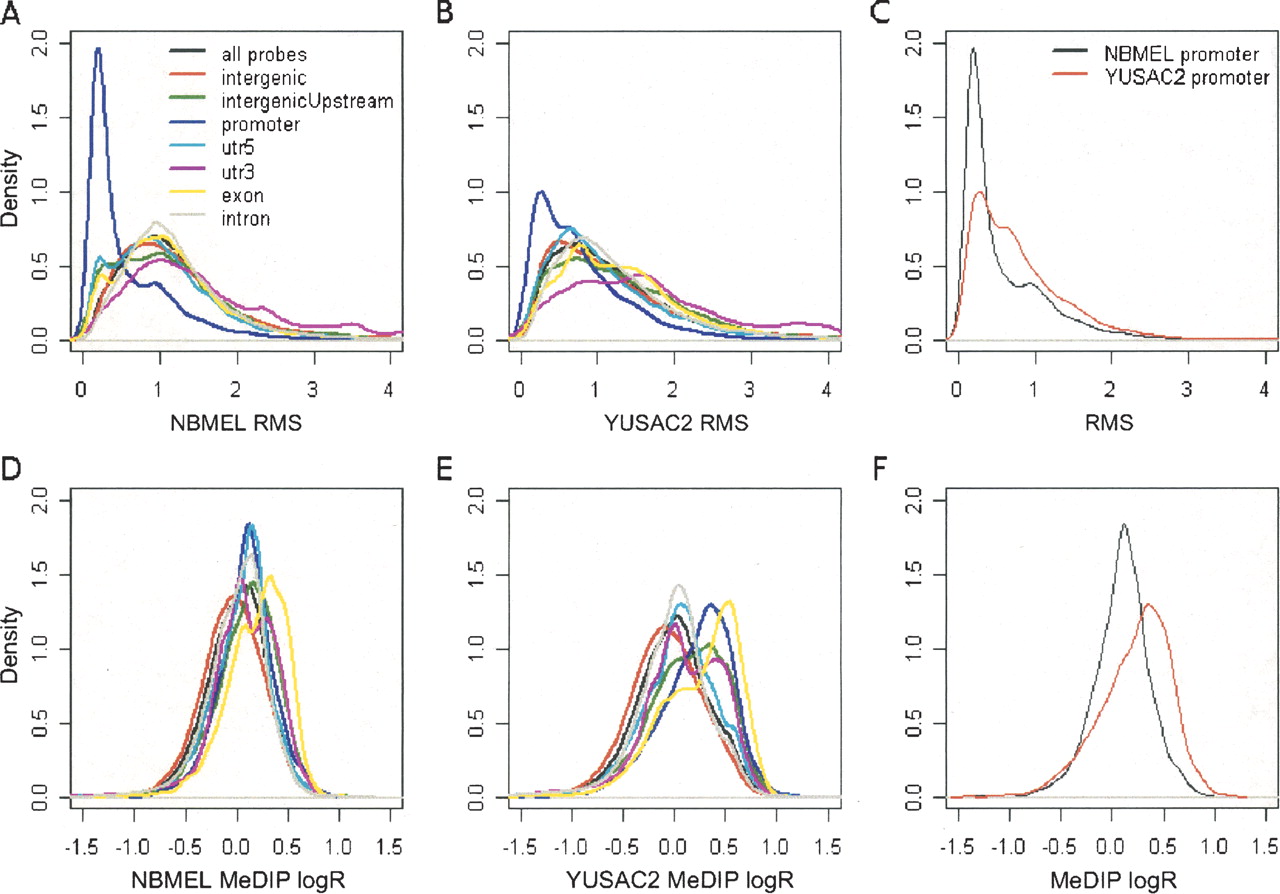
Figure 2.
Probe-level methylation in the different genomic regions. This figure shows the distribution of probe-level RMS in the different genomic regions for NBMEL (A) and YUSAC2 (B). Comparison of promoter RMS for the two samples is reported in C. Distribution of MeDIP logR in the different genomic regions for NBMEL (D) and YUSAC2 (E). Comparison of promoter MeDIP logR for the two samples is shown in F. All the distributions have been normalized by the number of probes in each genomic region. Promoter regions identify probes within 1 kb upstream of the TSS; intergenic Upstream identify probes within 1–4 kb upstream of the TSS.


