
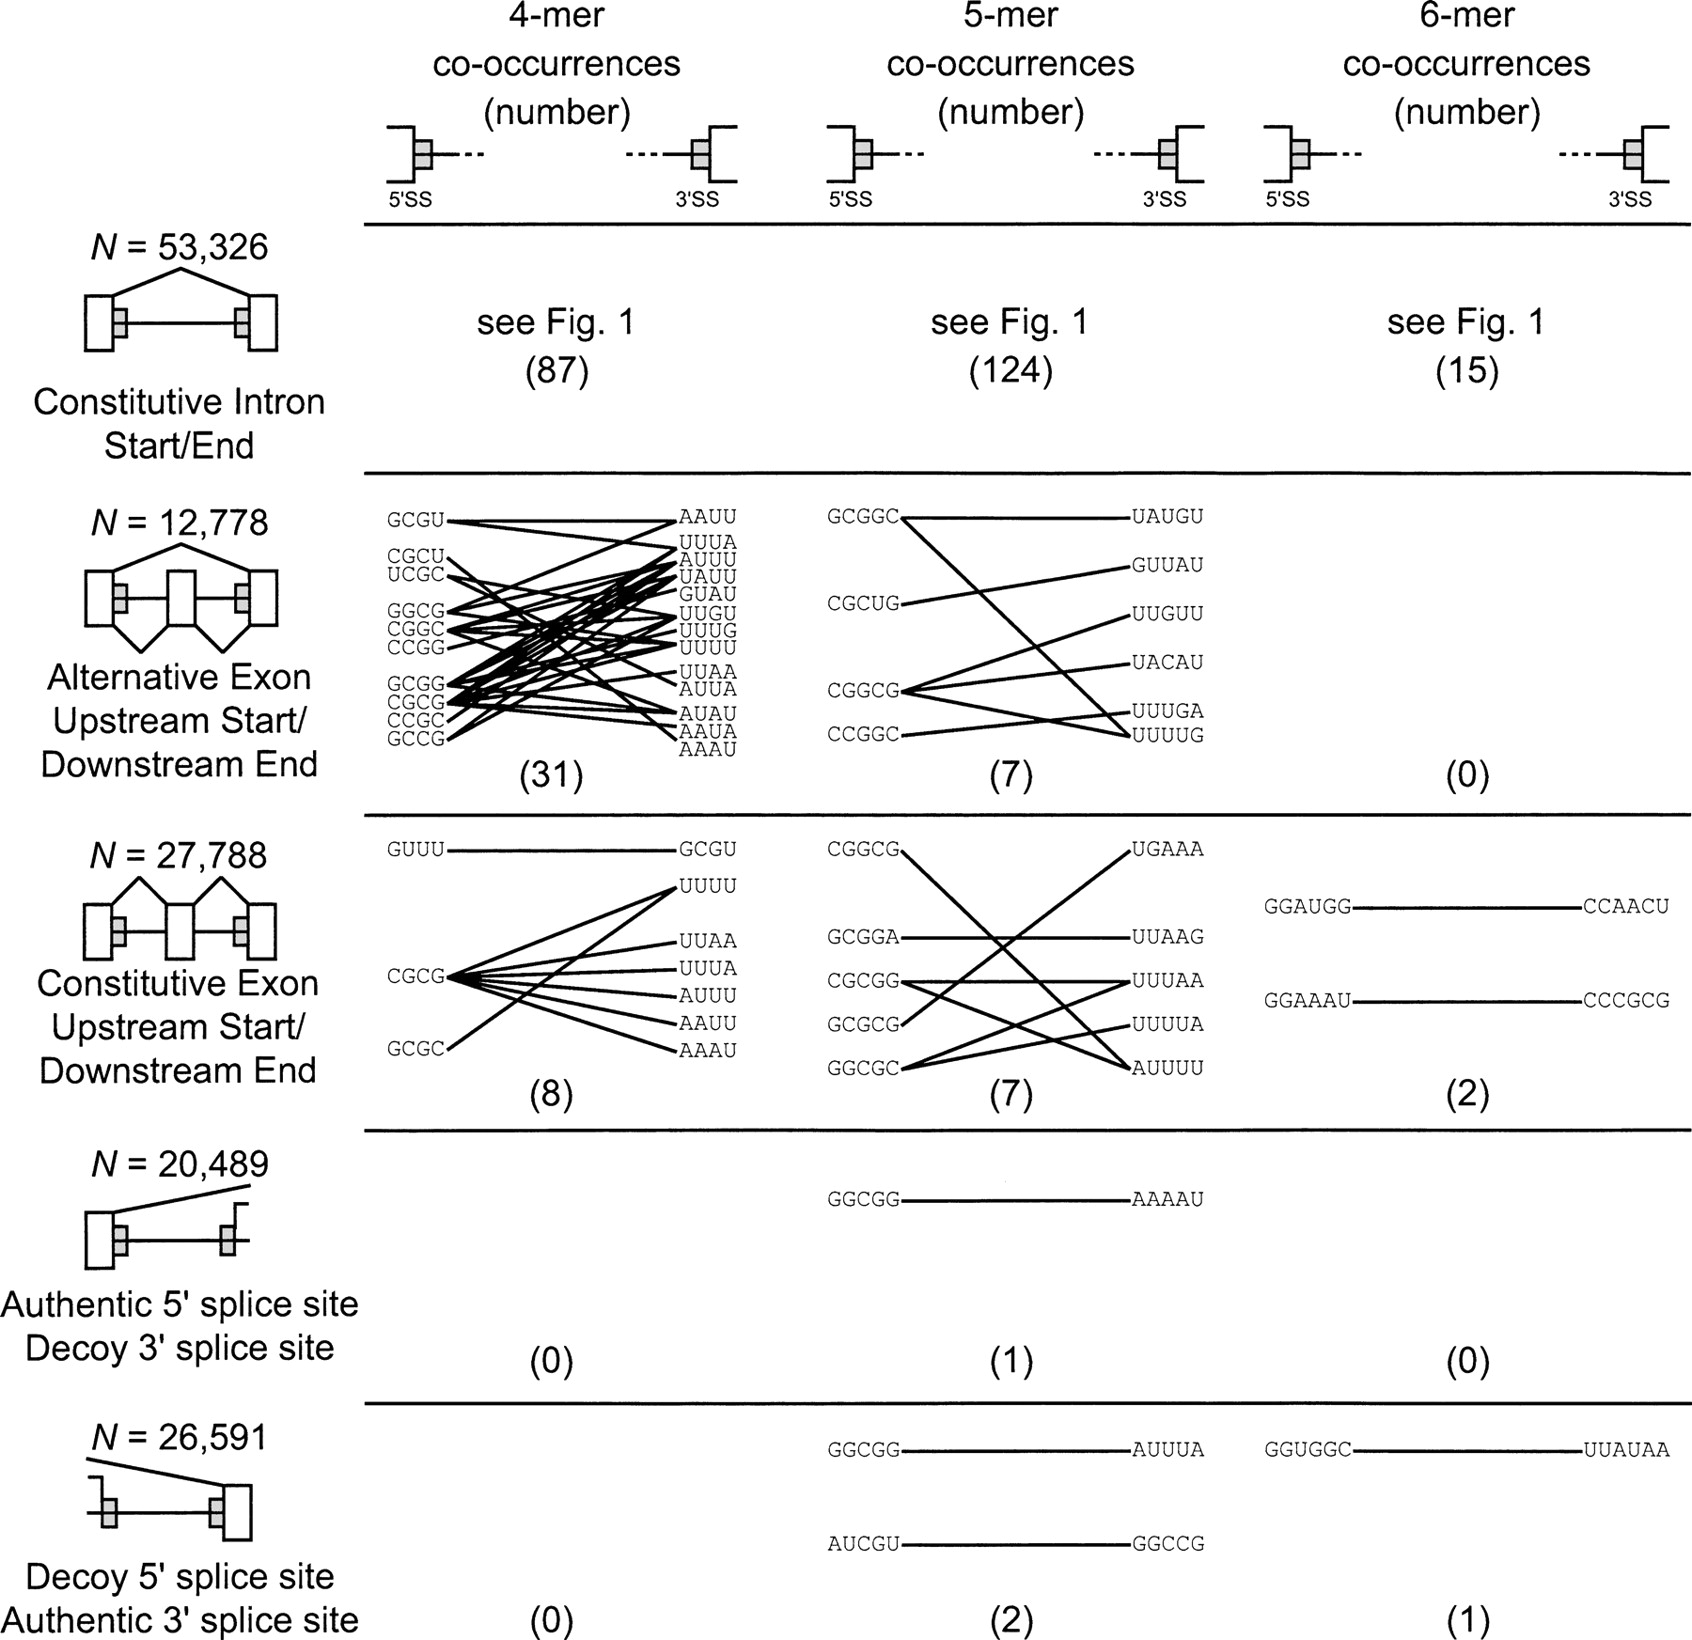
Figure 2.
Co-occurring motif pairs flanking alternative and constitutive exons and controls. Diagrams of the intron/exon data sets analyzed are shown at left, with exons shown as white boxes, introns as horizontal lines, and locations of the analyzed 80-nt regions shown as gray boxes. Splicing patterns are shown by angled lines; brackets indicate decoy splice sites. Representation of co-occurring k-mer pairs and P-value cutoffs as in Figure 1C–E. Numbers in parenthesis denote the number of significant k-mer pairs in each data set.


