
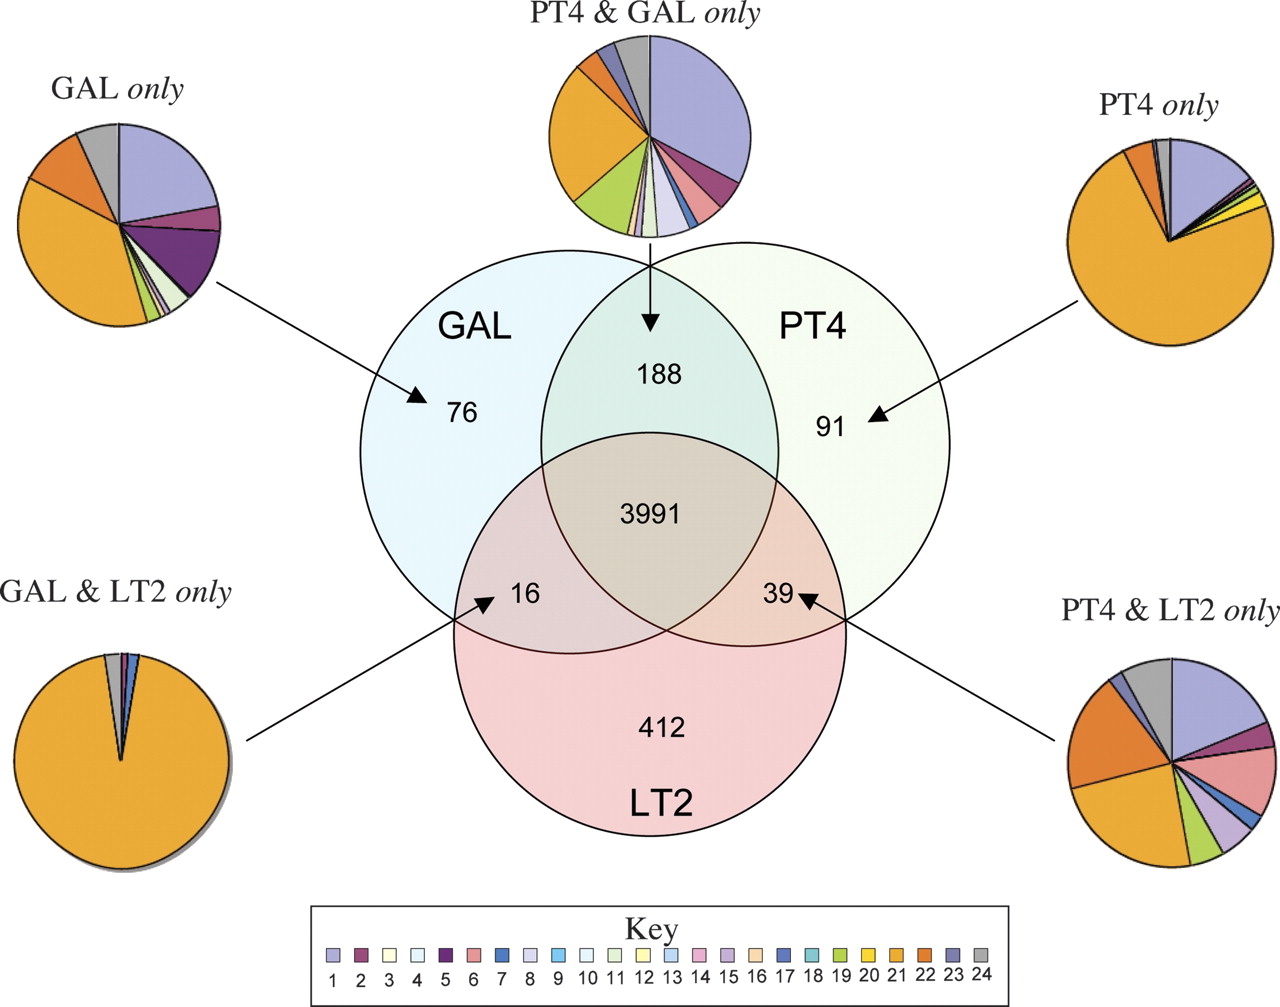
Distribution of orthologous CDS in S. Enteritidis PT4, S. Typhimurium LT2, and S. Gallinarum 287/91. The Venn diagram shows the number of genes unique or shared between two other S. enterica serovars (see Methods). The associated pie charts show the breakdown of the functional groups assigned for CDS in relevant sections of the Venn diagram. Color code for the pie charts is as follows: (1) hypothetical proteins, (2) conserved hypothetical proteins, (3) chemotaxis and motility, (4) chromosomal replication, (5) chaperones, (6) protective responses, (7) transport and binding proteins, (8) adaptations to atypical conditions, (9) cell division, (10) macromolecule degradation, (11) synthesis and modification of macromolecules, (12) amino acid biosynthesis, (13) biosynthesis of cofactors, prosthetic groups and carriers, (14) central intermediary metabolism, (15) small-molecule degradation, (16) energy metabolism, (17) fatty acid biosynthesis, (18) nucleosides and nucleotide biosynthesis and metabolism, (19) periplasmic/exported/lipoproteins, (20) ribosomal proteins, (21) laterally acquired (including prophage CDS), (22) pathogenicity and virulence, (23) general regulation, and (24) miscellaneous function. PT4 indicates S. Enteritidis PT4; LT2, S. Typhimurium LT2; and GAL, S. Gallinarum 287/91


