
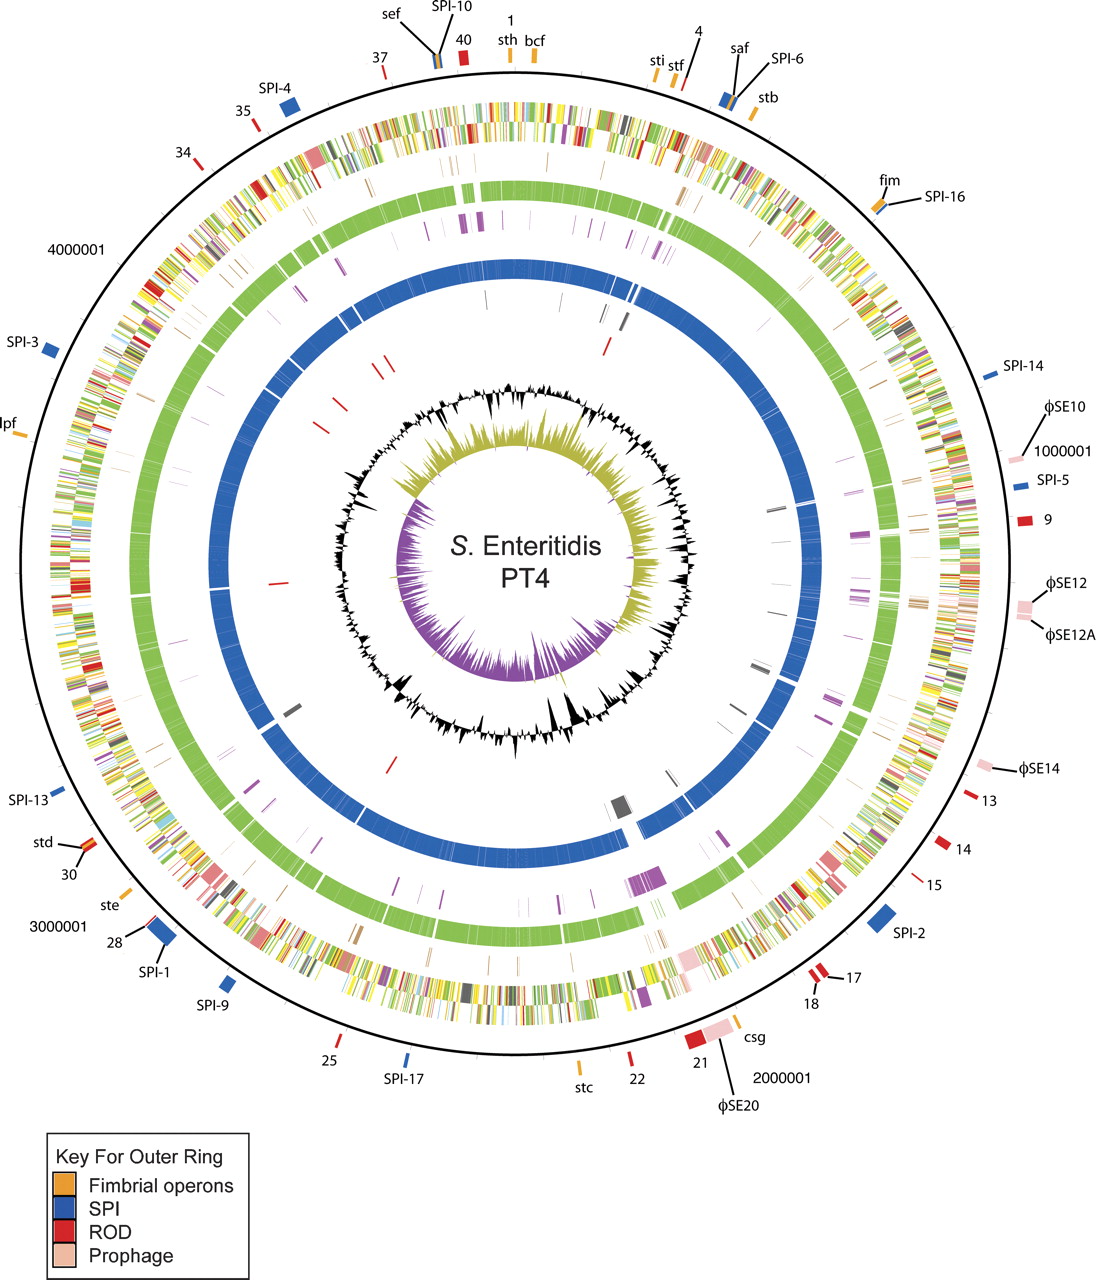
Circular representation of the S. Enteritidis PT4 chromosome. From the outside in, the outer circle 1 marks the position of regions of difference (mentioned in the text) and is detailed in Table 2. Circle 2 shows the size in base pairs. Circles 3 and 4 show the position of CDS transcribed in a clockwise and anti-clockwise direction, respectively (for color codes see below); circle 5 shows the position of S. Enteritidis PT4 pseudogenes. Circles 6 and 8 show the position of S. Enteritidis PT4 genes that have orthologs (by reciprocal FASTA analysis) in S. Typhimurium strain LT2 (all CDS colored green) and S. Gallinarum strain 287/91 (all CDS colored blue), respectively. Circles 7 and 9 show the position of S. Enteritidis PT4 genes that lack orthologs in (by reciprocal FASTA analysis) in S. Typhimurium strain LT2 (all CDS colored pink) and S. Gallinarum strain 287/91 (all CDS colored gray), respectively. Circle 10 shows the position of S. Enteritidis PT4 rRNA operons (red). Circle 11 shows a plot of G + C content (in a 10-kb window). Circle 12 shows a plot of GC skew ([G − C]/[G + C]; in a 10-kb window). Genes in circles 3 and 4 are color-coded according to the function of their gene products: dark green, membrane or surface structures; yellow, central or intermediary metabolism; cyan, degradation of macromolecules; red, information transfer/cell division; cerise, degradation of small molecules; pale blue, regulators; salmon pink, pathogenicity or adaptation; black, energy metabolism; orange, conserved hypothetical; pale green, unknown; and brown, pseudogenes.


