
Ratios of S. cerevisiae:S. bayanus array intensities
Click on table to view larger version.
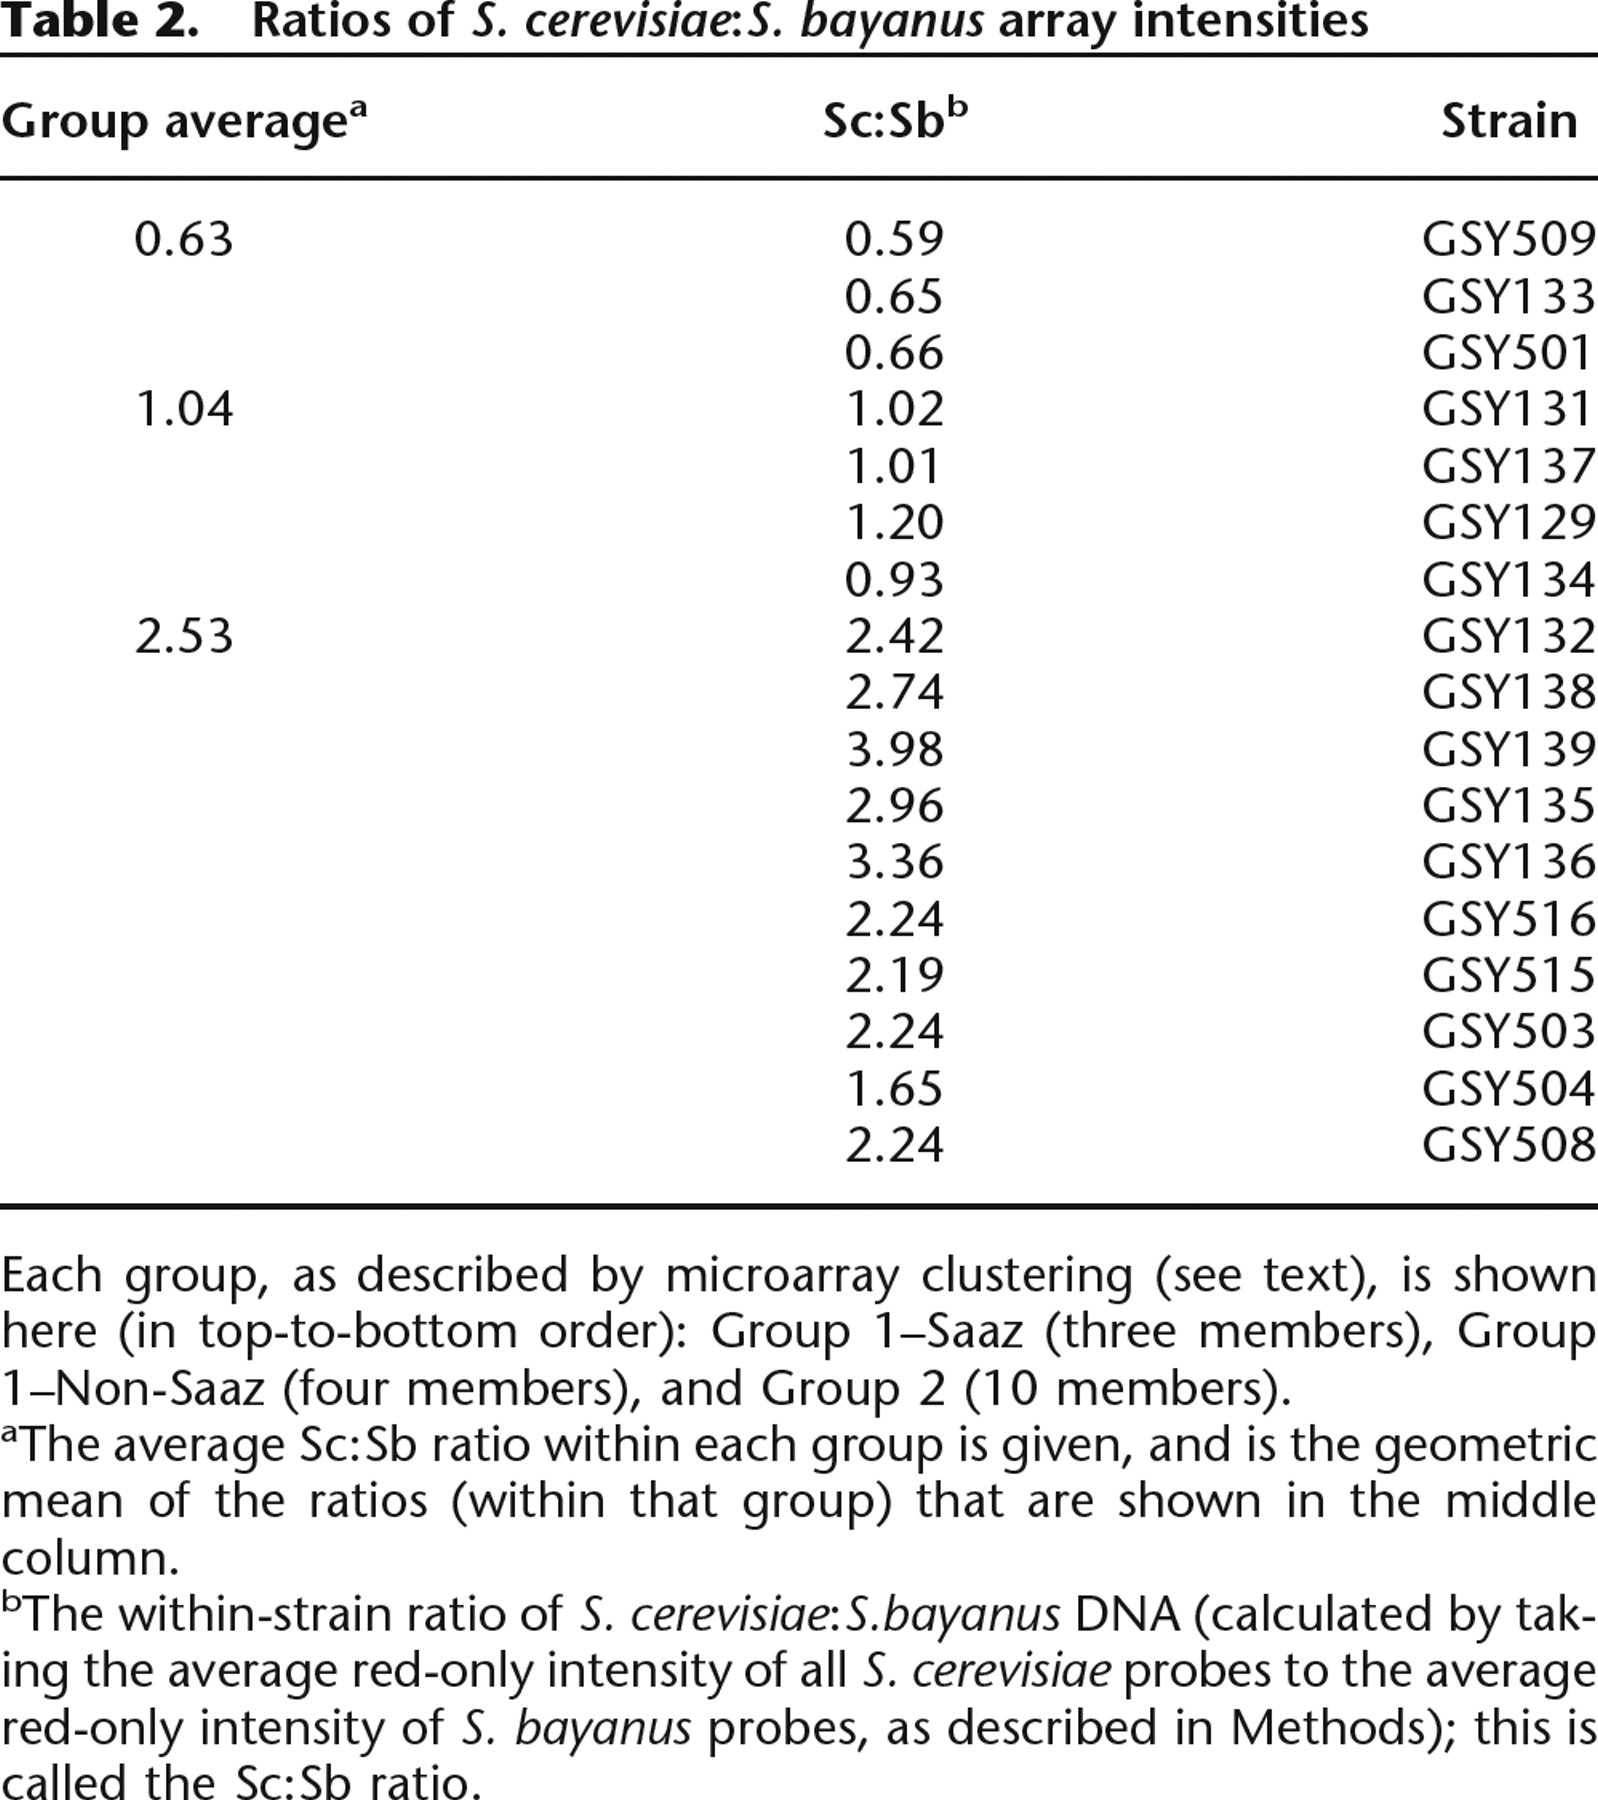
Each group, as described by microarray clustering (see text), is shown here (in top-to-bottom order): Group 1–Saaz (three members), Group 1–Non-Saaz (four members), and Group 2 (10 members).
aThe average Sc:Sb ratio within each group is given, and is the geometric mean of the ratios (within that group) that are shown in the middle column.
bThe within-strain ratio of S. cerevisiae:S.bayanus DNA (calculated by taking the average red-only intensity of all S. cerevisiae probes to the average red-only intensity of S. bayanus probes, as described in Methods); this is called the Sc:Sb ratio.


