
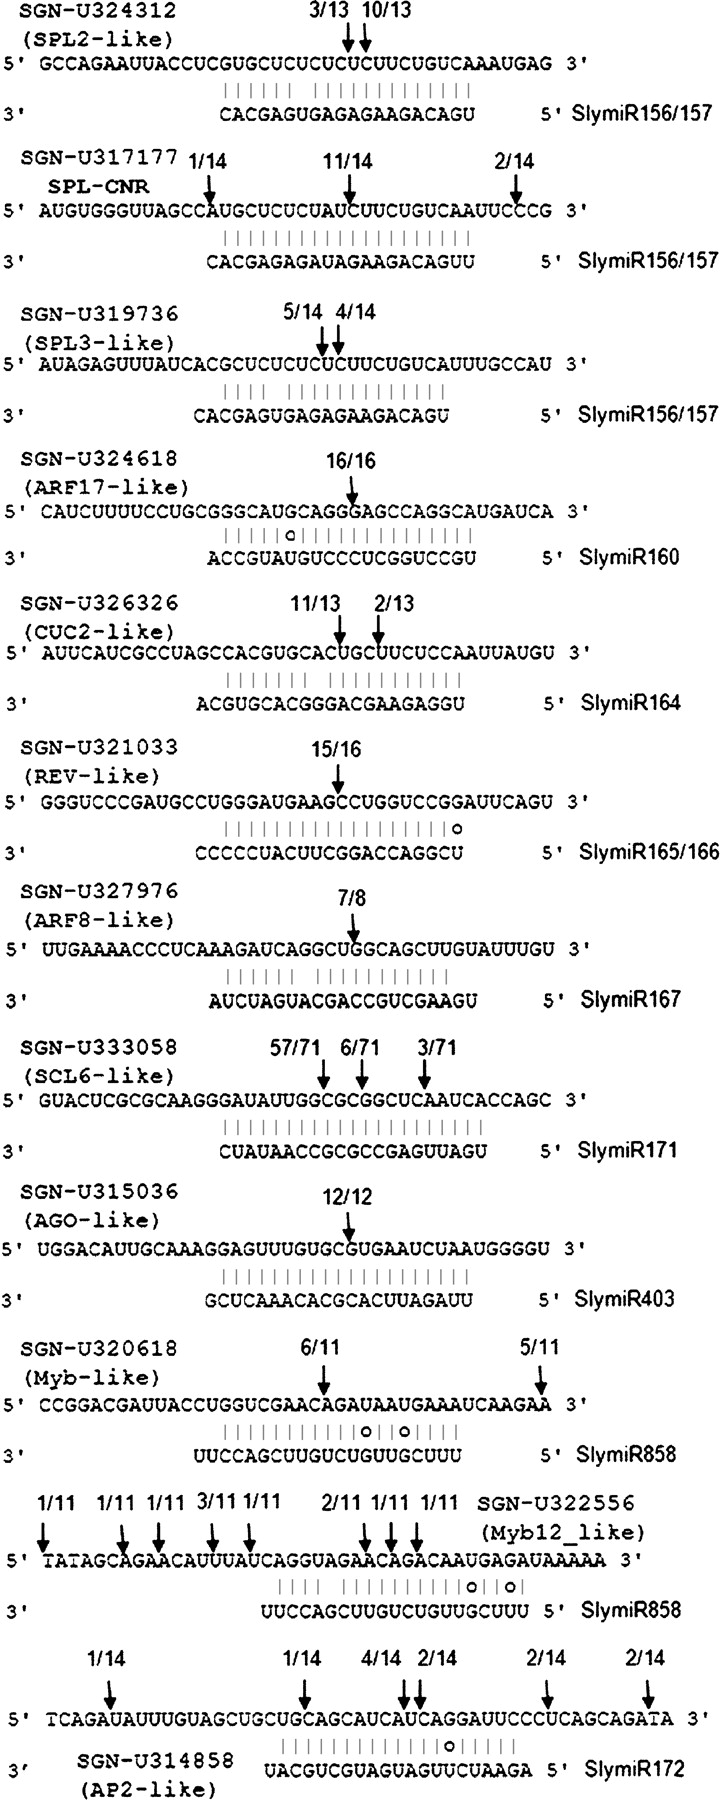
Figure 2.
Target validation of conserved tomato miRNAs. 5′-RACE analysis was carried out for each predicted target gene. (Arrows) The 5′-ends of cleavage products. Cleavage sites outside of the displayed sequence are not shown. Target EST sequences are shown on top of the miRNA sequences.


