
Table 2.
Comparison of proportion of accelerated regions in coding and noncoding genomic regions in flies and humans
Click on table to view larger version.
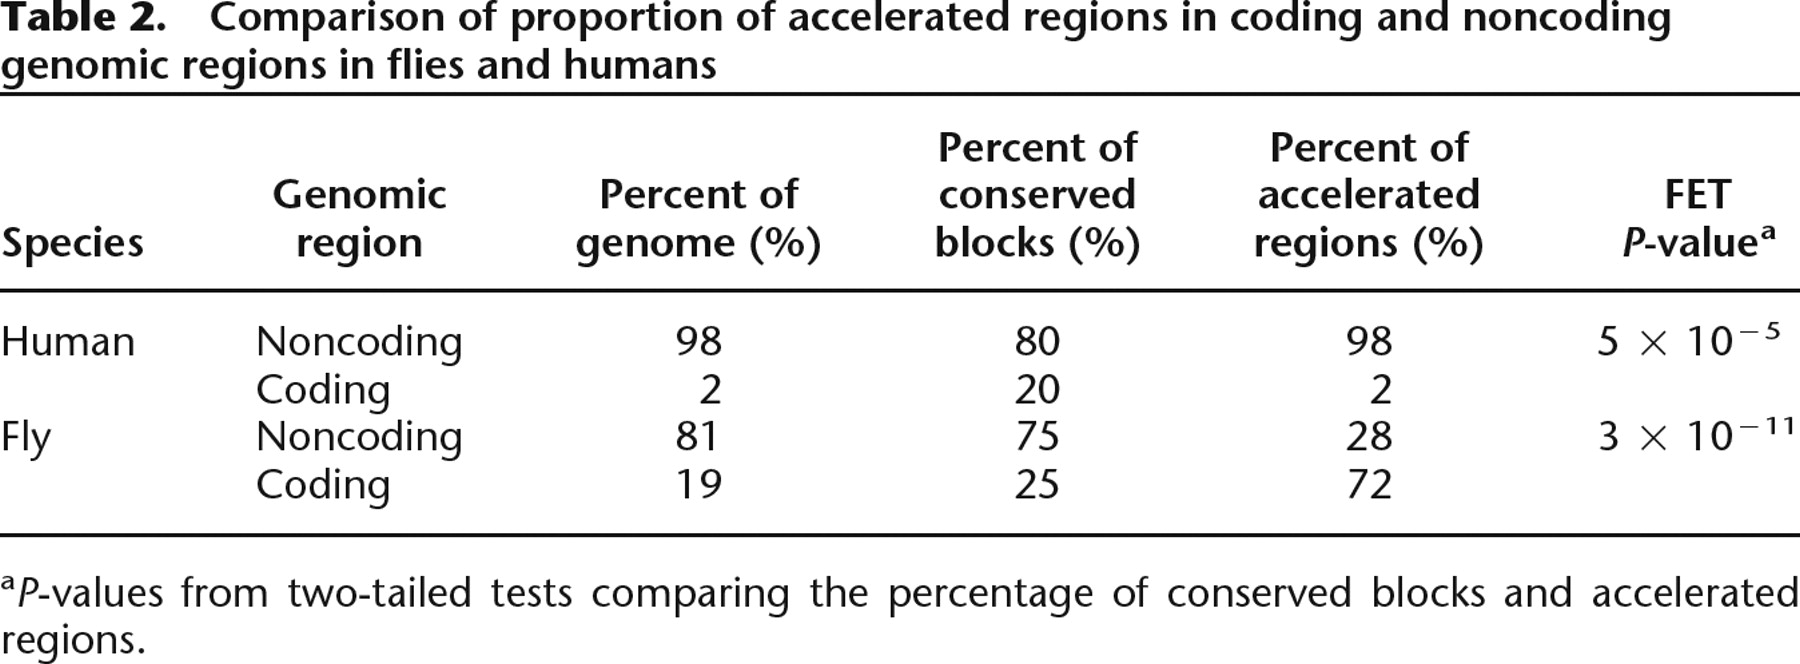
aP-values from two-tailed tests comparing the percentage of conserved blocks and accelerated regions.


