
Estimates of genomic rearrangement in vertebrates and their ancestors
Click on table to view larger version.
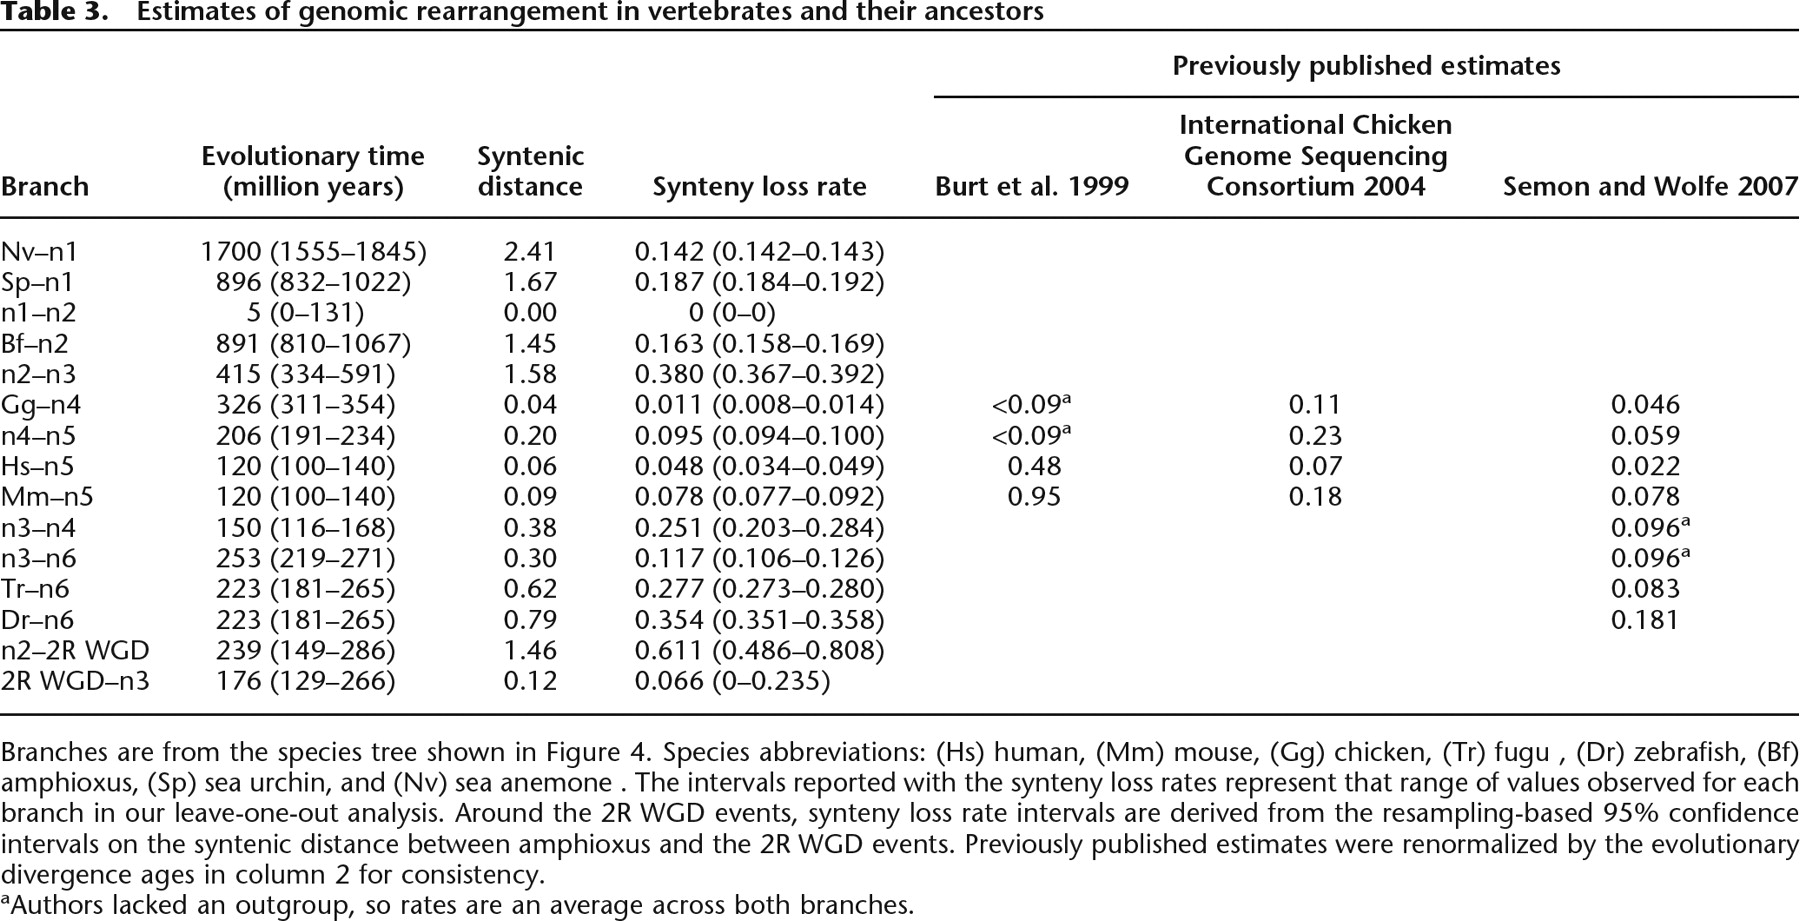
Branches are from the species tree shown in Figure 4. Species abbreviations: (Hs) human, (Mm) mouse, (Gg) chicken, (Tr) fugu , (Dr) zebrafish, (Bf) amphioxus, (Sp) sea urchin, and (Nv) sea anemone. The intervals reported with the synteny loss rates represent that range of values observed for each branch in our leave-one-out analysis. Around the 2R WGD events, synteny loss rate intervals are derived from the resampling-based 95% confidence intervals on the syntenic distance between amphioxus and the 2R WGD events. Previously published estimates were renormalized by the evolutionary divergence ages in column 2 for consistency.
aAuthors lacked an outgroup, so rates are an average across both branches.


