
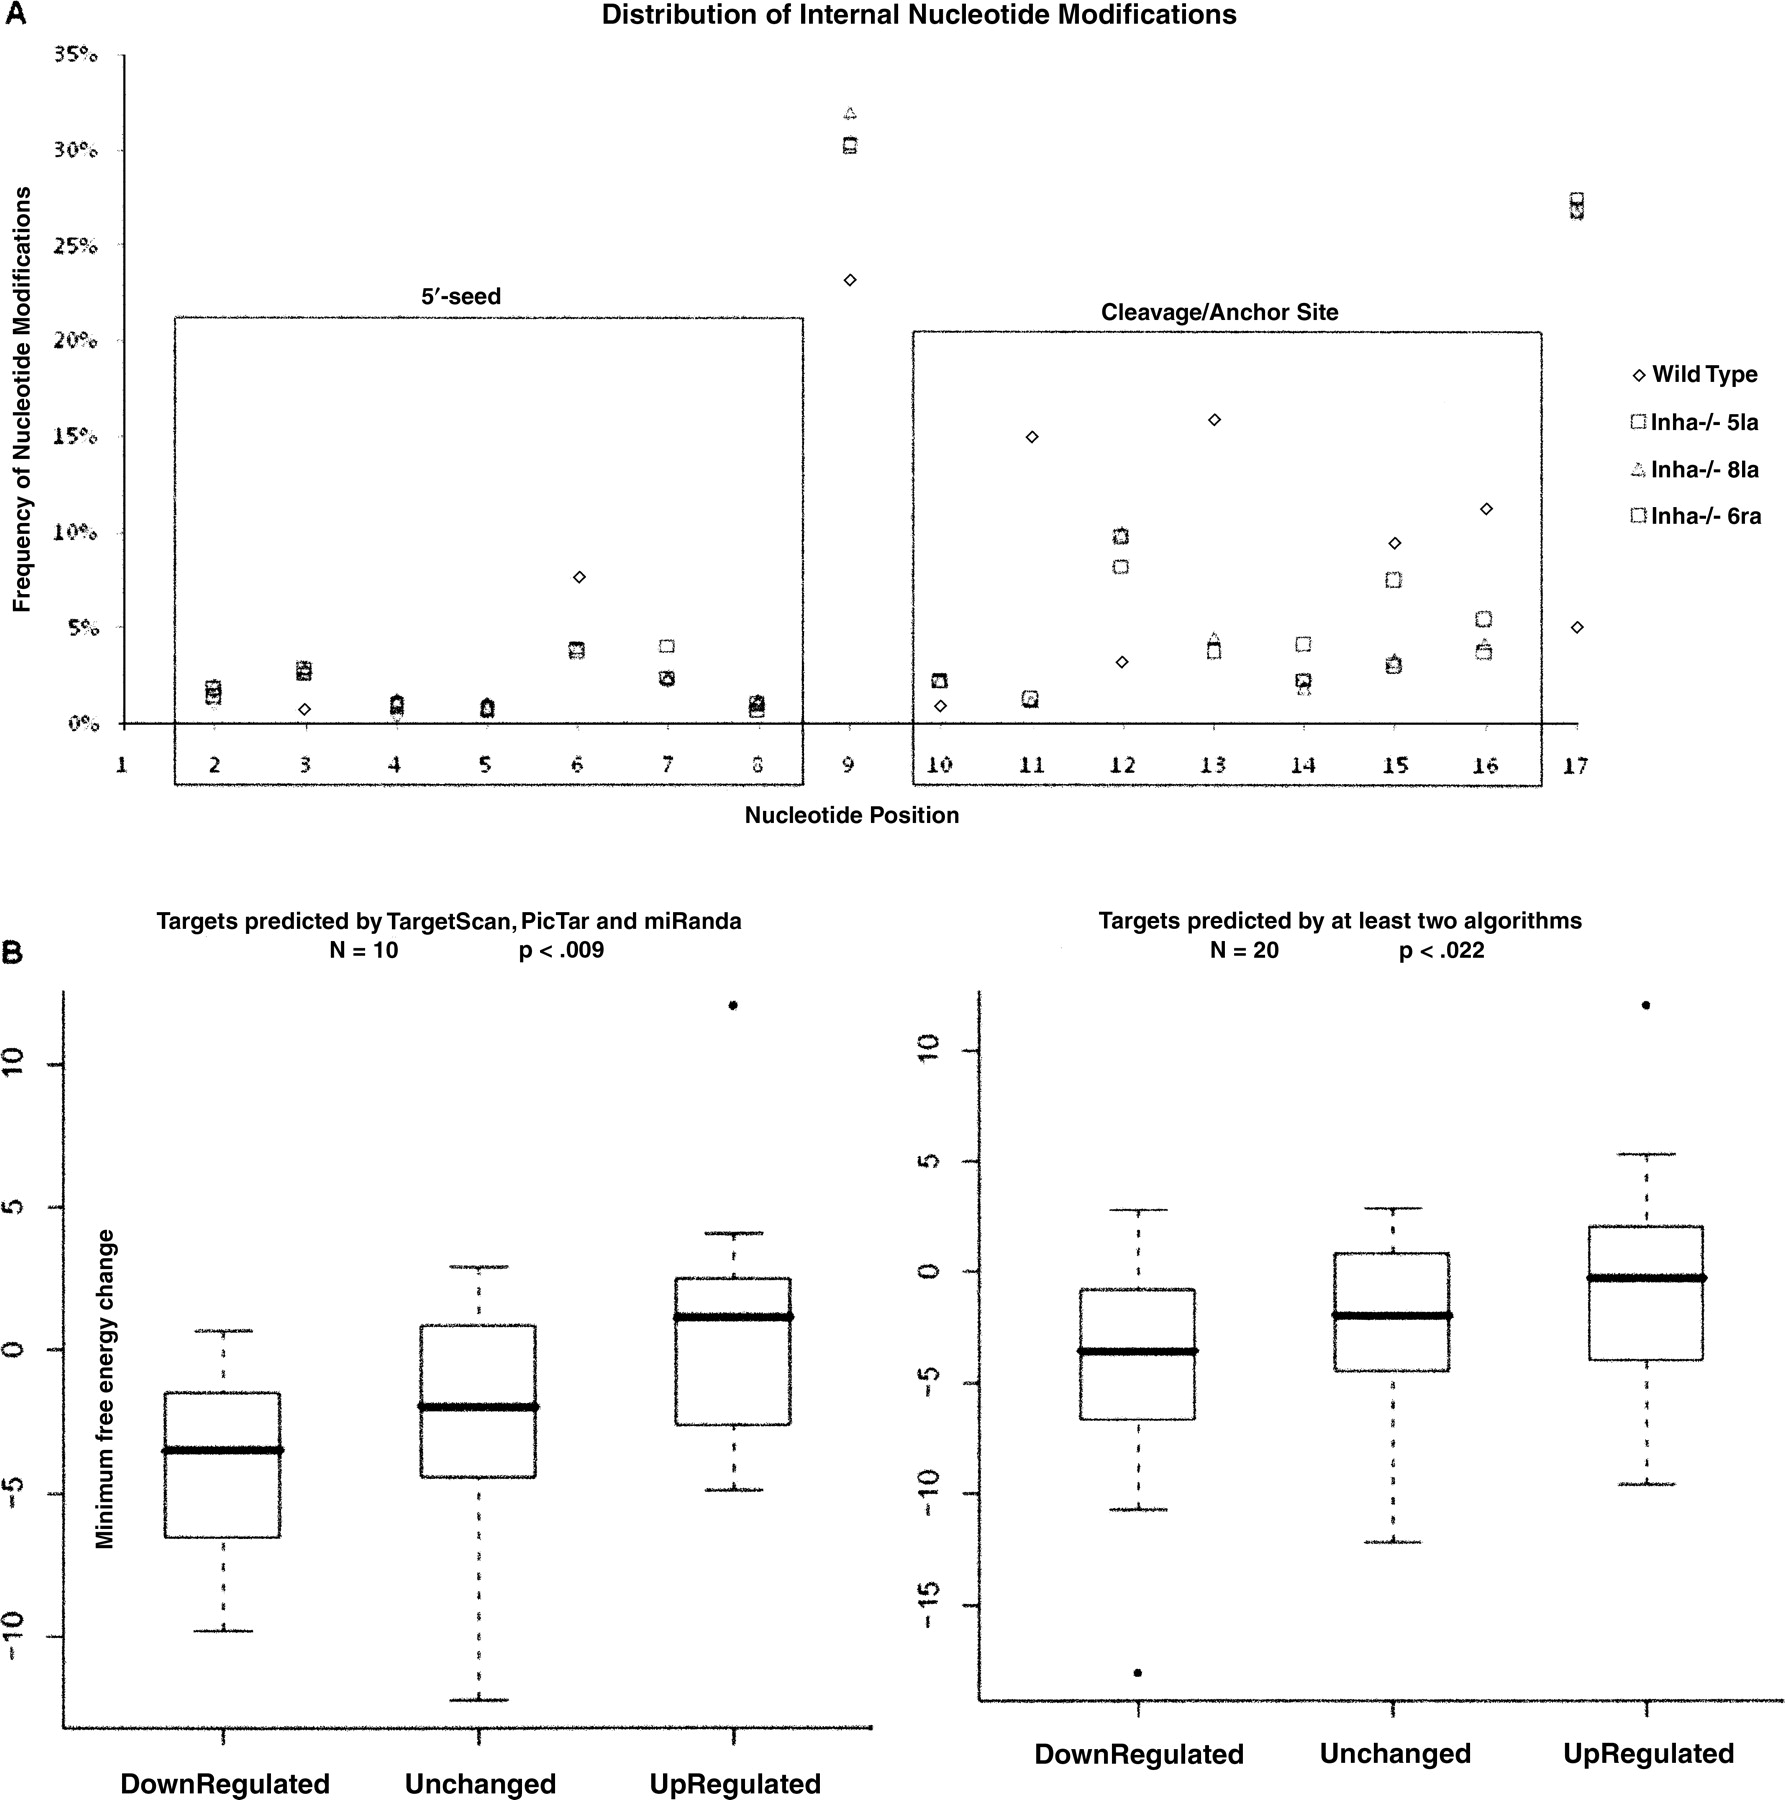
(A) Relative distribution of internal nucleotide modifications associated with miRNAs from wild-type and Inha−/− mutant ovaries. This panel shows the distribution of nucleotide changes in relation to internal positions (nucleotides 2–17) associated with miRNAs from wild-type and mutant ovaries. Modifications are highly suppressed in nucleotides 2–8 (containing the seed region that is important for miRNA–mRNA binding) and nucleotides 10–15 in all four samples. In sharp contrast, modifications are frequent at the ninth position. In addition, there is a significant increase in ninth position modifications in all three mutants (average frequency of 31%) as compared to wild type (23%). (B) Impact of ninth nucleotide U-to-G modification on mmu-let-7a targets in the Inha−/− mutants. This panel shows a comparison of Δmfe among three groups of mmu-let-7a targets that exhibit down-regulation, no change, and up-regulation, respectively, in the Inha−/− mutant ovaries as compared with wild type. The Inha−/− mutants show on the average a ∼11-fold increase in expression as compared to wild type and an increase in the frequency of ninth nucleotide modification from 23% (wild type) to 31% (mutants) (Supplemental Table ST5). In this experiment we selected 20 genes each from the list of target genes shown in Supplemental Table ST6 to represent down-regulated, unchanged, and up-regulated categories. All mmu-let-7a target site sequences were analyzed against the canonical mmu-let-7a miRNA sequence and compared with mmu-let-7a miRNA containing the ninth nucleotide edit. The minimum free energy changes (Δmfe) associated with canonical versus edited duplexes are shown in Supplemental Table ST7. The left panel shows results from 10 target genes that are predicted by all three algorithms, and the right panel shows 10 genes predicted by all three algorithms and 10 genes predicted by at least two algorithms. A Wilcoxon test specifically comparing the up-regulated targets versus down-regulated targets (including all data points) shows that down-regulated targets exhibit a Δmfe (mmu-let-7a wild type vs. mmu-let-7a-edited) that is significantly lower (P < 0.009 and P < 0.022) than the up-regulated targets. Although the unchanged targets show an average Δmfe of −2.1, this difference is not significant from up- or down-regulated targets.


