
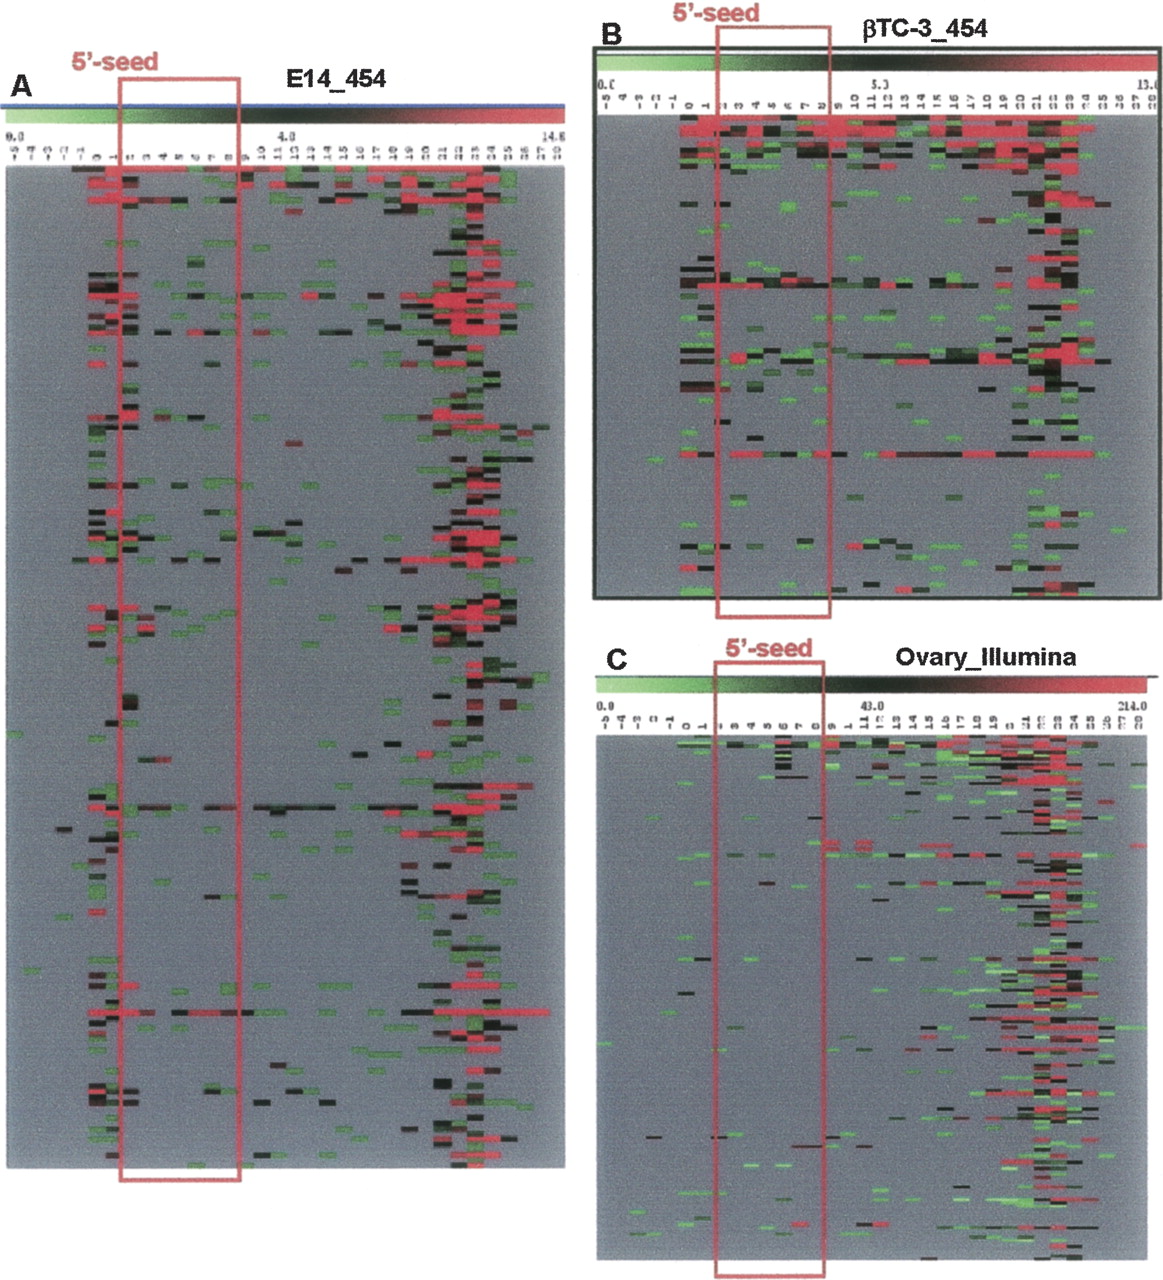
Figure 2.
Heat maps summarizing nucleotide modifications across all miRNAs that exhibit “loose matches.” Heat maps were generated by finding all “loose matches” to the pre-miR precursors. Sequence signatures with a copy number ≥ 10 are represented. Each row here represents an individual miRNA. Each column represents a nucleotide position. The values are plotted along a scale of red to green (shown at top), showing the number of changes: (red) high; (black) medium; (green) low; (gray) no changes. (A) Data from E14.5 sequenced through 454; (B) data from βTC-3 sequenced through 454; (C) data from adult mouse ovary sequenced through Illumina.


