
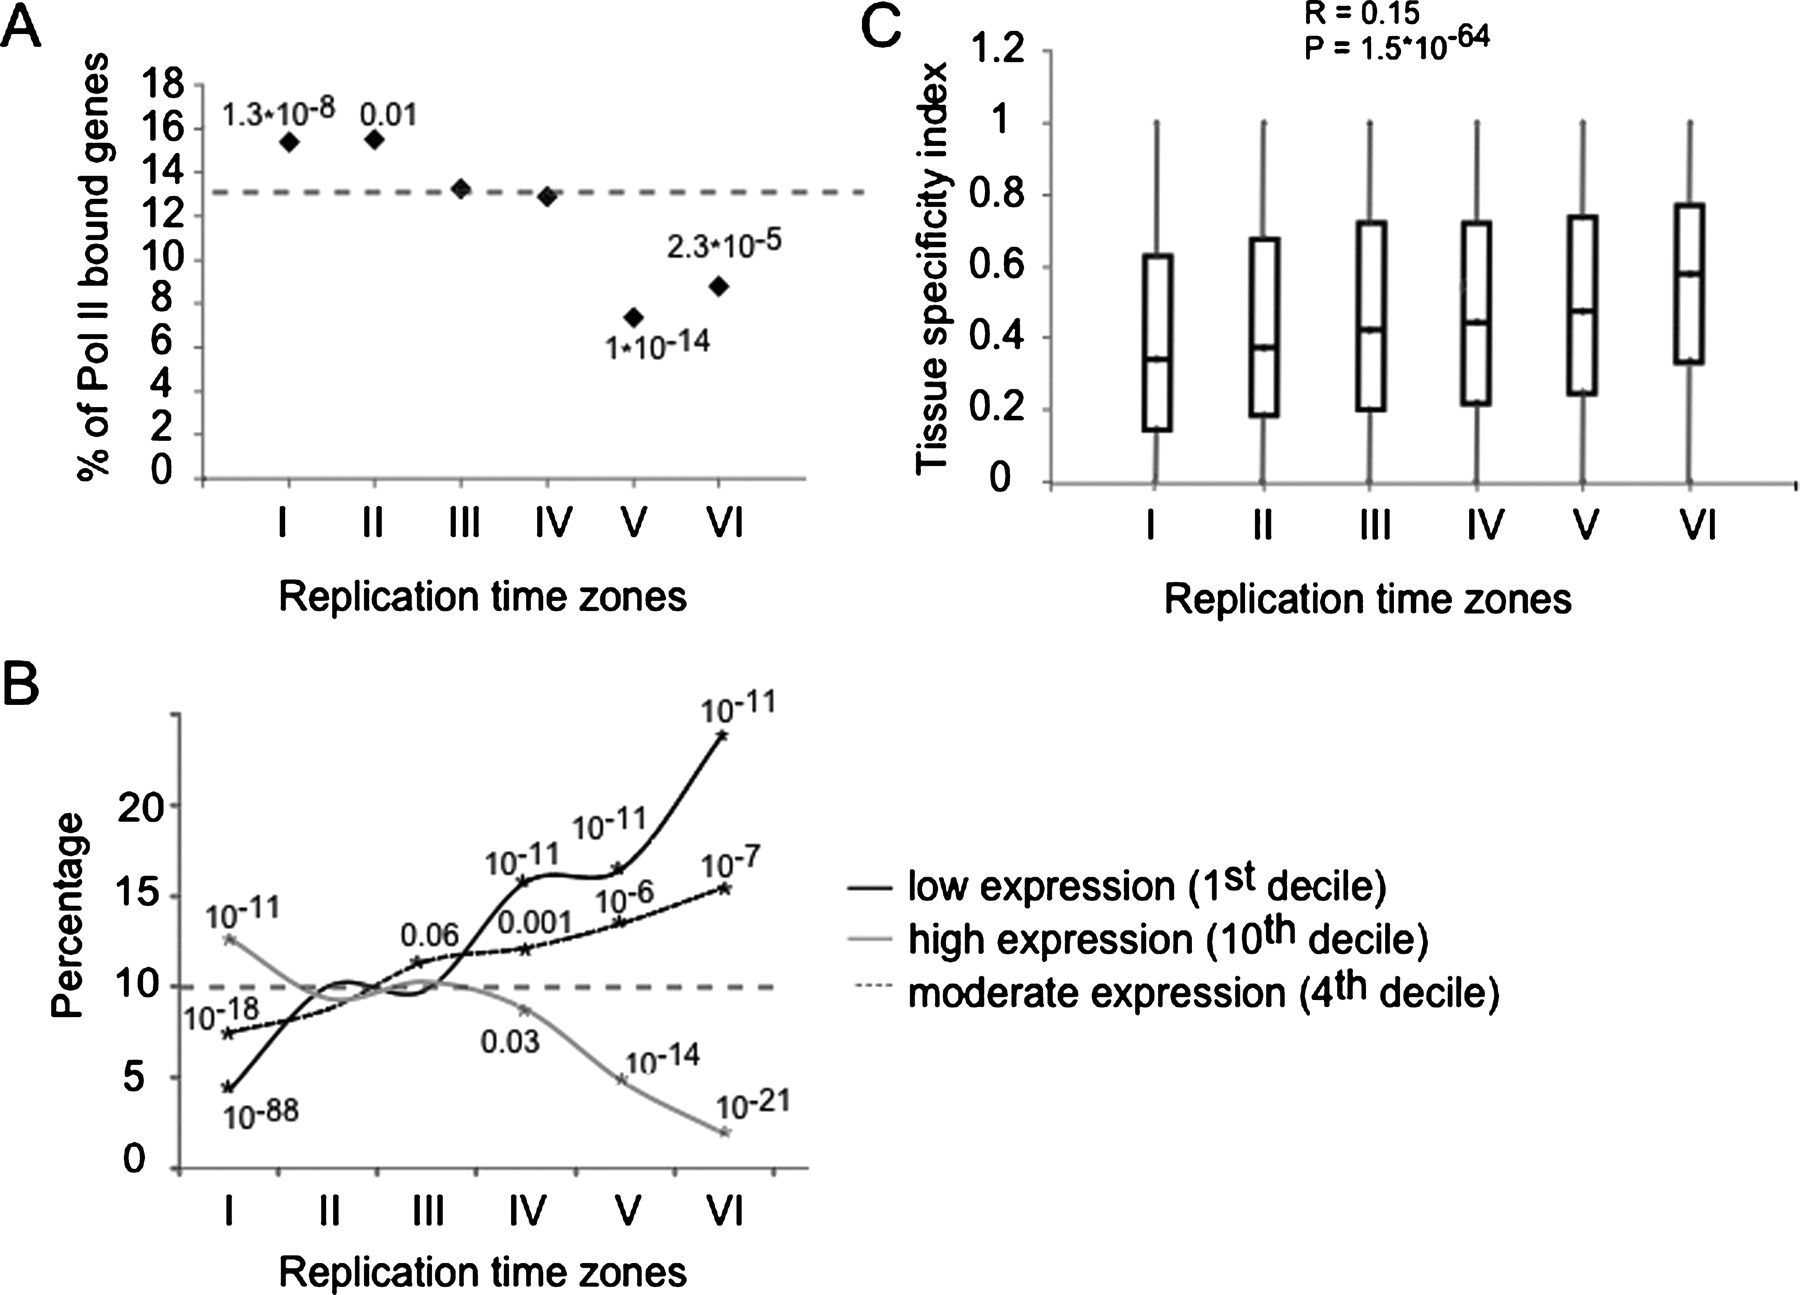
Coordination between replication and transcription. (A) The percentage of genes in each replication time (I–VI) associated with RNA polymerase II (log2 ratio > 0.5) in a ChIP-chip experiment is shown along with the hypergeometric test P-values for cases enriched (clusters I and II) or depleted (clusters V and VI) over the expected average Pol II association (dashed line). (B) The percentage of genes in each replication time zone that fall into the first, fourth, and 10th expression deciles in blood cells. Significant enrichments or depletions over the expected value of 10% (dashed horizontal line) are shown (asterisks and hypergeometric P-values). Early clusters are enriched with highly expressed genes (10th decile) and depleted with low expressed genes (first decile) while late clusters show the opposite pattern. Middle clusters are enriched with genes expressed at moderate levels (fourth decile). (C) Box plot representation of the tissue specificity index distribution for each cluster. Early clusters tend to contain more house-keeping genes (index close to 0) while late clusters tend to contain more tissue-specific genes (index close to 1).


