
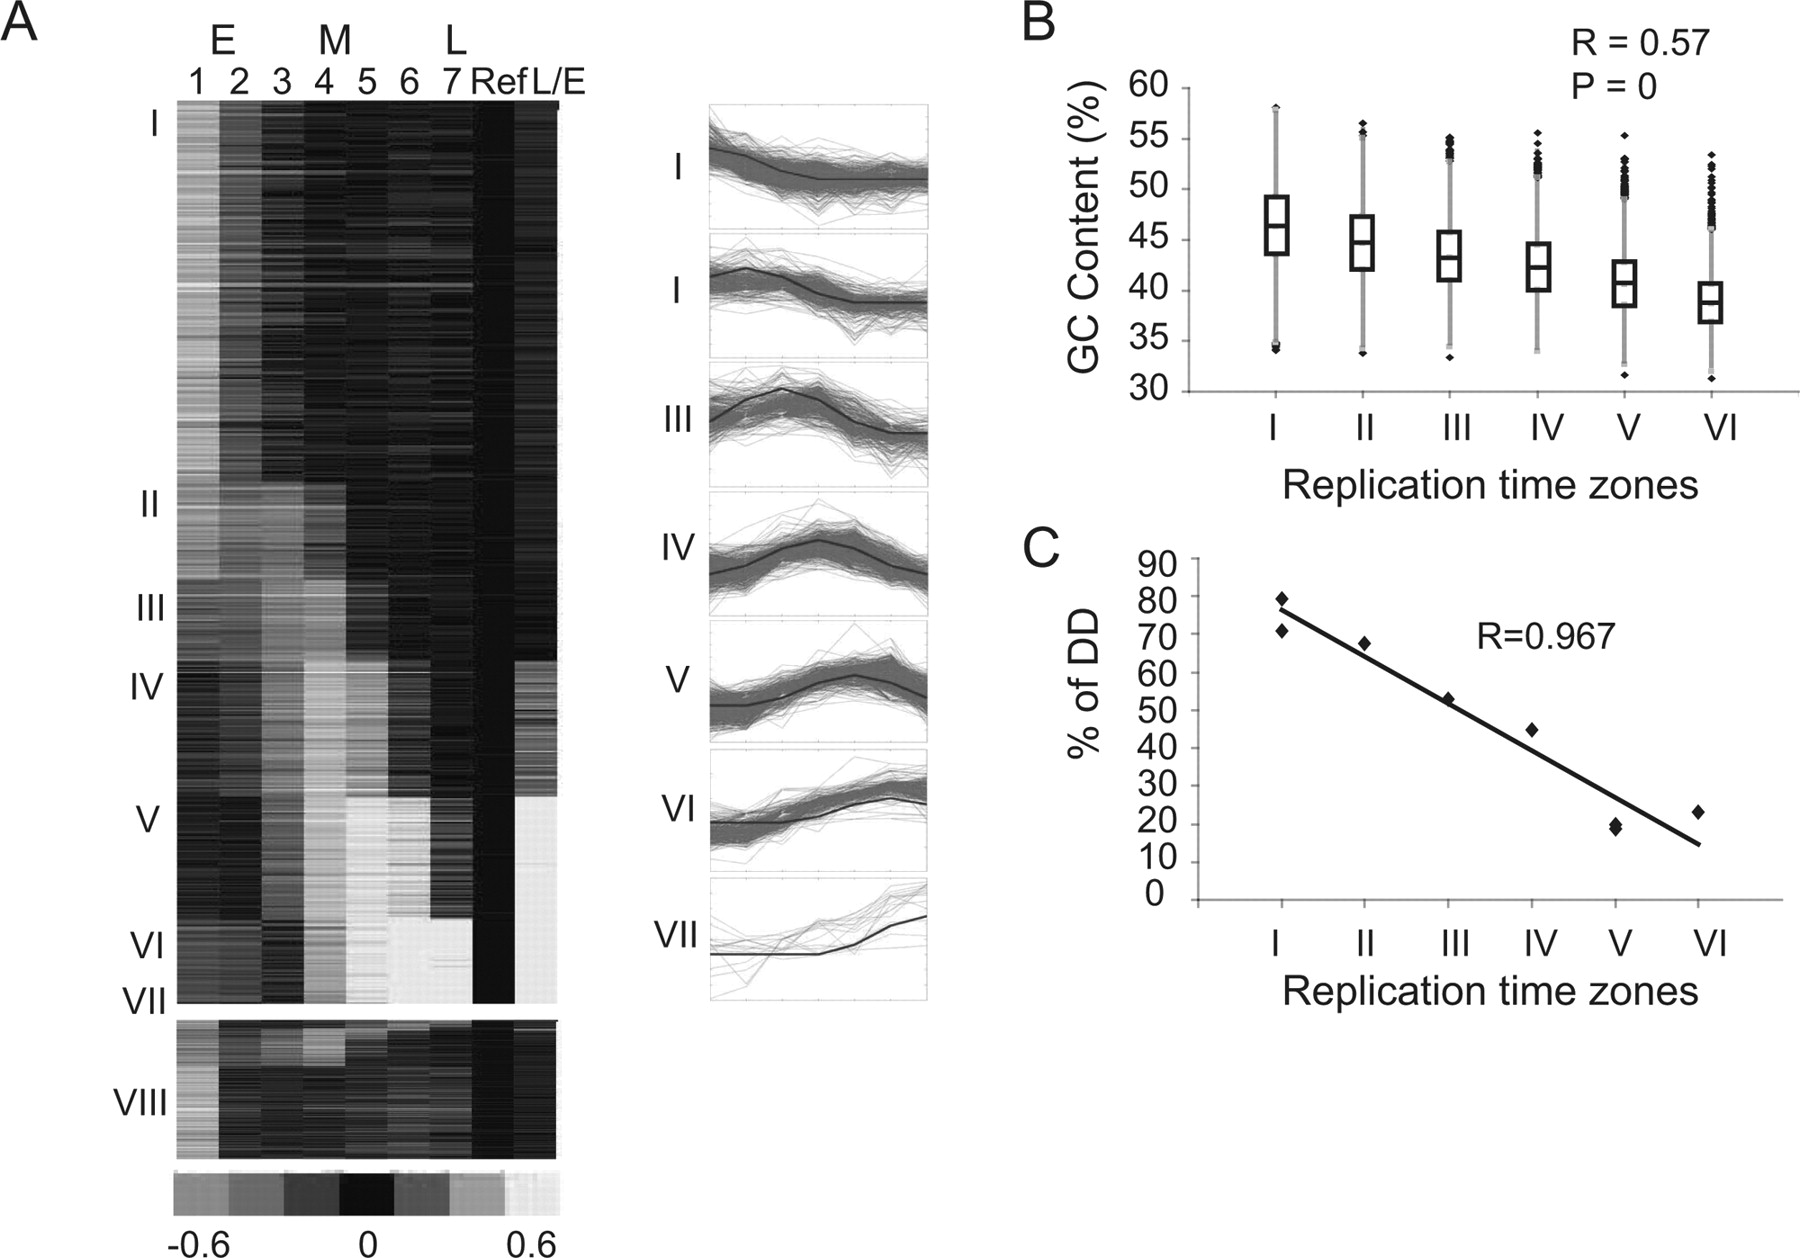
Genomic replication timing clustering and validation. (A) The seven predefined patterns (blue) and the probes assigned to each pattern (red, shown on right). A heat-map representation of the genomic data arranged according to the seven clusters (I–VII) is shown on the left. Asynchronous probes that were not assigned to any cluster (VIII) are shown at the bottom. (B) Box plot representation (the box marks the first, second and third quartiles; the whiskers mark values of ±1.5 interquartile range [IQR]; and outliers are marked by black dots) of the GC content of all regions assigned to each cluster. Cluster VII was excluded from this and subsequent analyses since it contains a small number of regions. The correlation to a regression line (R) and the P-value calculated by the F-statistics are shown. (C) FISH-based validation of replication timing. The ToR of eight regions as determined by the percentage of S-phase nuclei in which both alleles are seen as doublets (%DD) is drawn against the ToR of those probes as determined by the array. Additional FISH results are provided in Supplemental Figure S7.


