
Intrinsic base-stacking and repeat tract length
Click on table to view larger version.
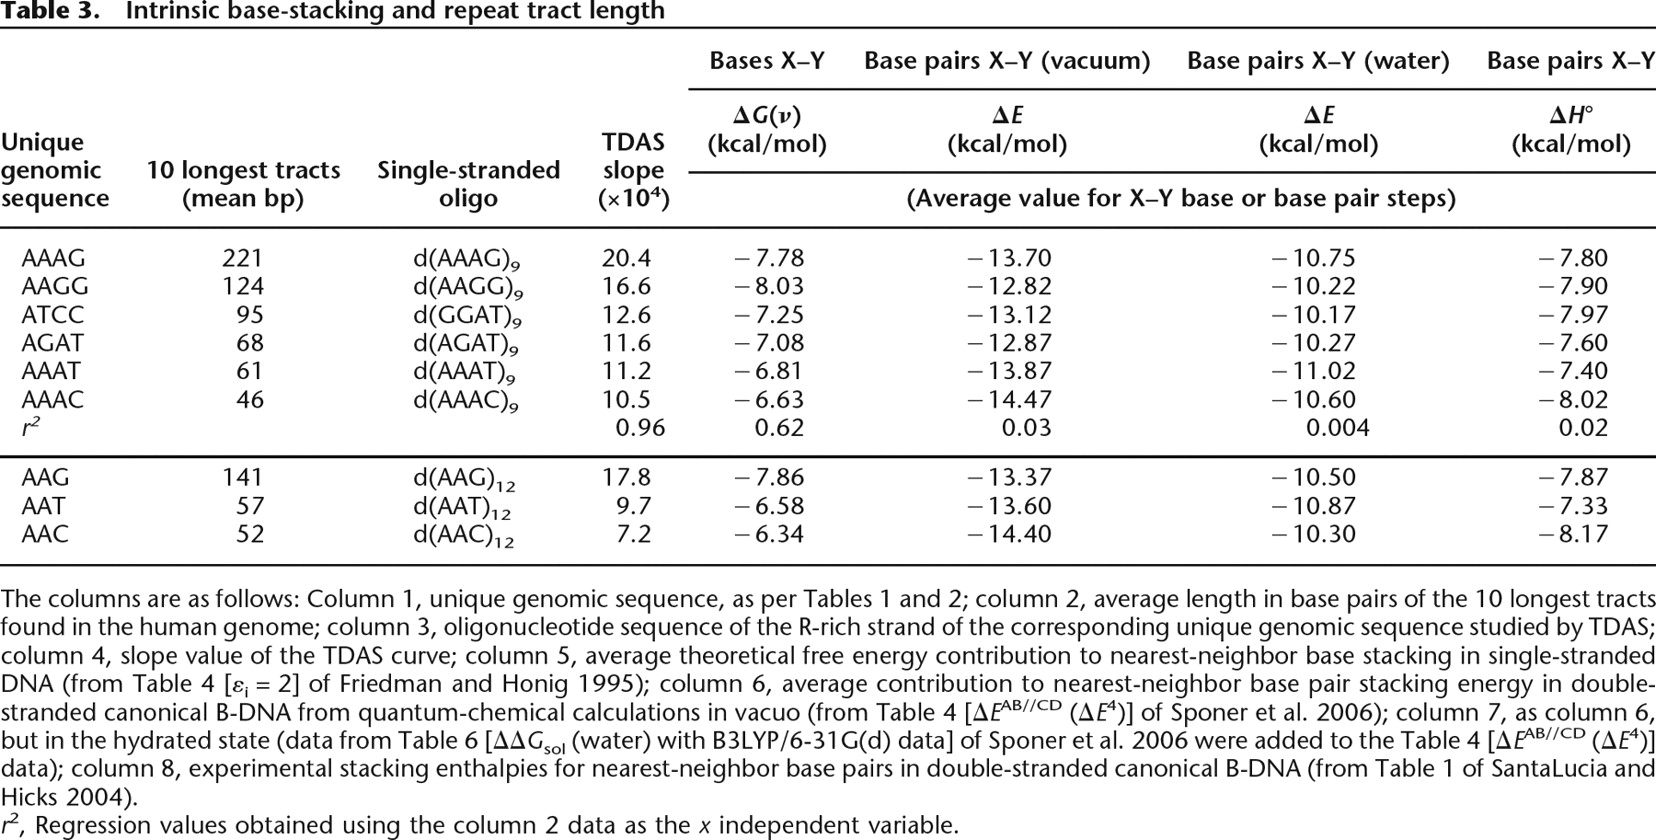
The columns are as follows: Column 1, unique genomic sequence, as per Tables 1 and 2; column 2, average length in base pairs of the 10 longest tracts found in the human genome; column 3, oligonucleotide sequence of the R-rich strand of the corresponding unique genomic sequence studied by TDAS; column 4, slope value of the TDAS curve; column 5, average theoretical free energy contribution to nearest-neighbor base stacking in single-stranded DNA (from Table 4 [εi = 2] of Friedman and Honig 1995); column 6, average contribution to nearest-neighbor base pair stacking energy in double-stranded canonical B-DNA from quantum-chemical calculations in vacuo (from Table 4 [ΔEAB//CD (ΔE4)] of Sponer et al. 2006); column 7, as column 6, but in the hydrated state (data from Table 6 [ΔΔGsol (water) with B3LYP/6-31G(d) data] of Sponer et al. 2006 were added to the Table 4 [ΔEAB//CD (ΔE4)] data); column 8, experimental stacking enthalpies for nearest-neighbor base pairs in double-stranded canonical B-DNA (from Table 1 of SantaLucia and Hicks 2004).
r2, Regression values obtained using the column 2 data as the x independent variable.


