
TriNR abundances and Ta values
Click on table to view larger version.
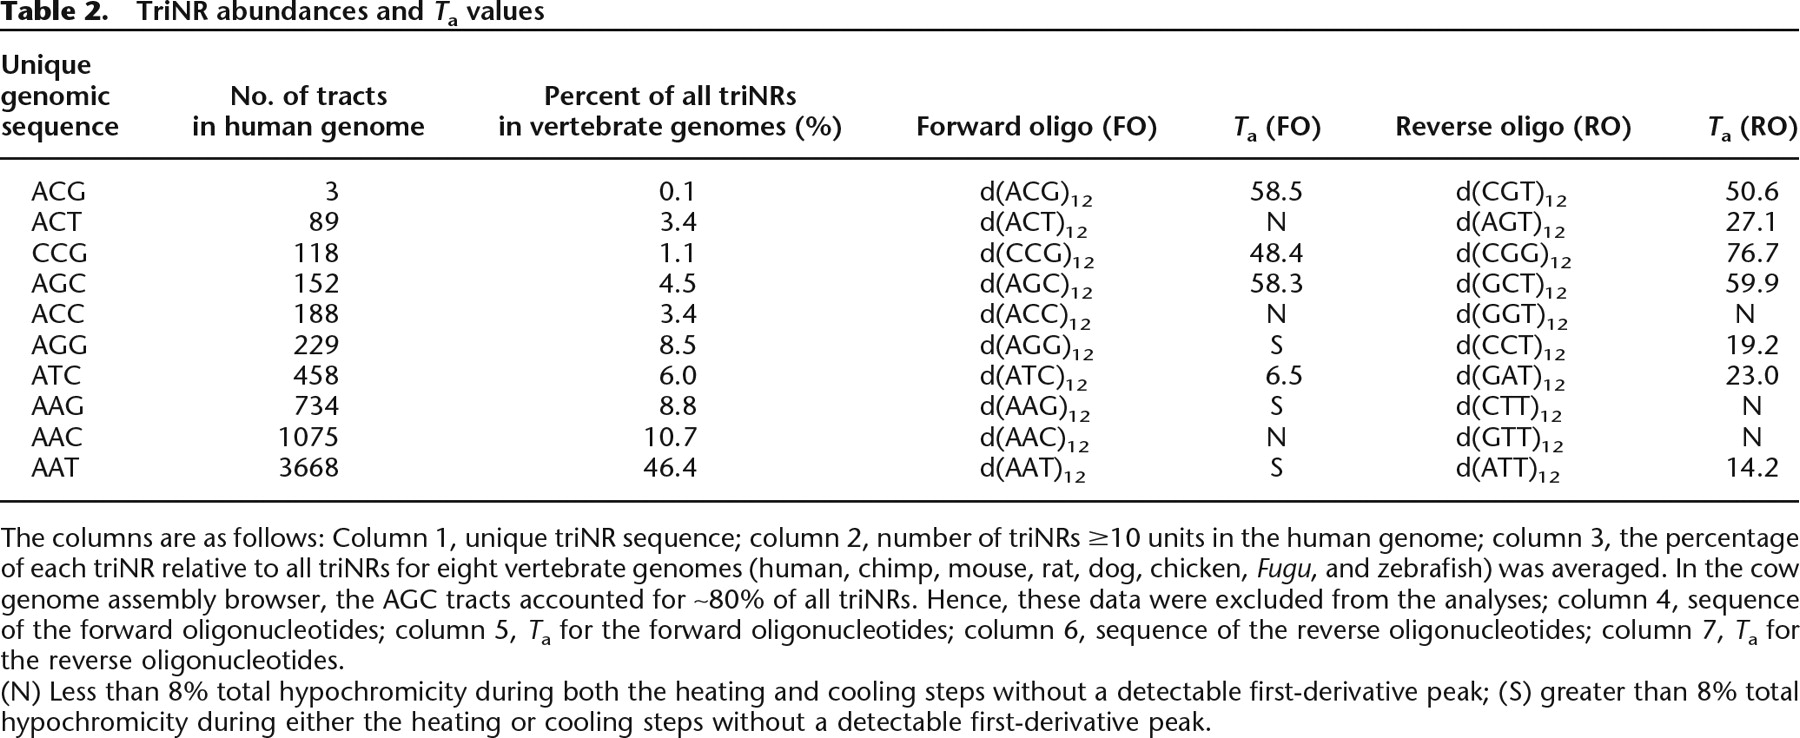
The columns are as follows: Column 1, unique triNR sequence; column 2, number of triNRs ≥10 units in the human genome; column 3, the percentage of each triNR relative to all triNRs for eight vertebrate genomes (human, chimp, mouse, rat, dog, chicken, Fugu, and zebrafish) was averaged. In the cow genome assembly browser, the AGC tracts accounted for ∼80% of all triNRs. Hence, these data were excluded from the analyses; column 4, sequence of the forward oligonucleotides; column 5, Ta for the forward oligonucleotides; column 6, sequence of the reverse oligonucleotides; column 7, Ta for the reverse oligonucleotides.
(N) Less than 8% total hypochromicity during both the heating and cooling steps without a detectable first-derivative peak; (S) greater than 8% total hypochromicity during either the heating or cooling steps without a detectable first-derivative peak.


