
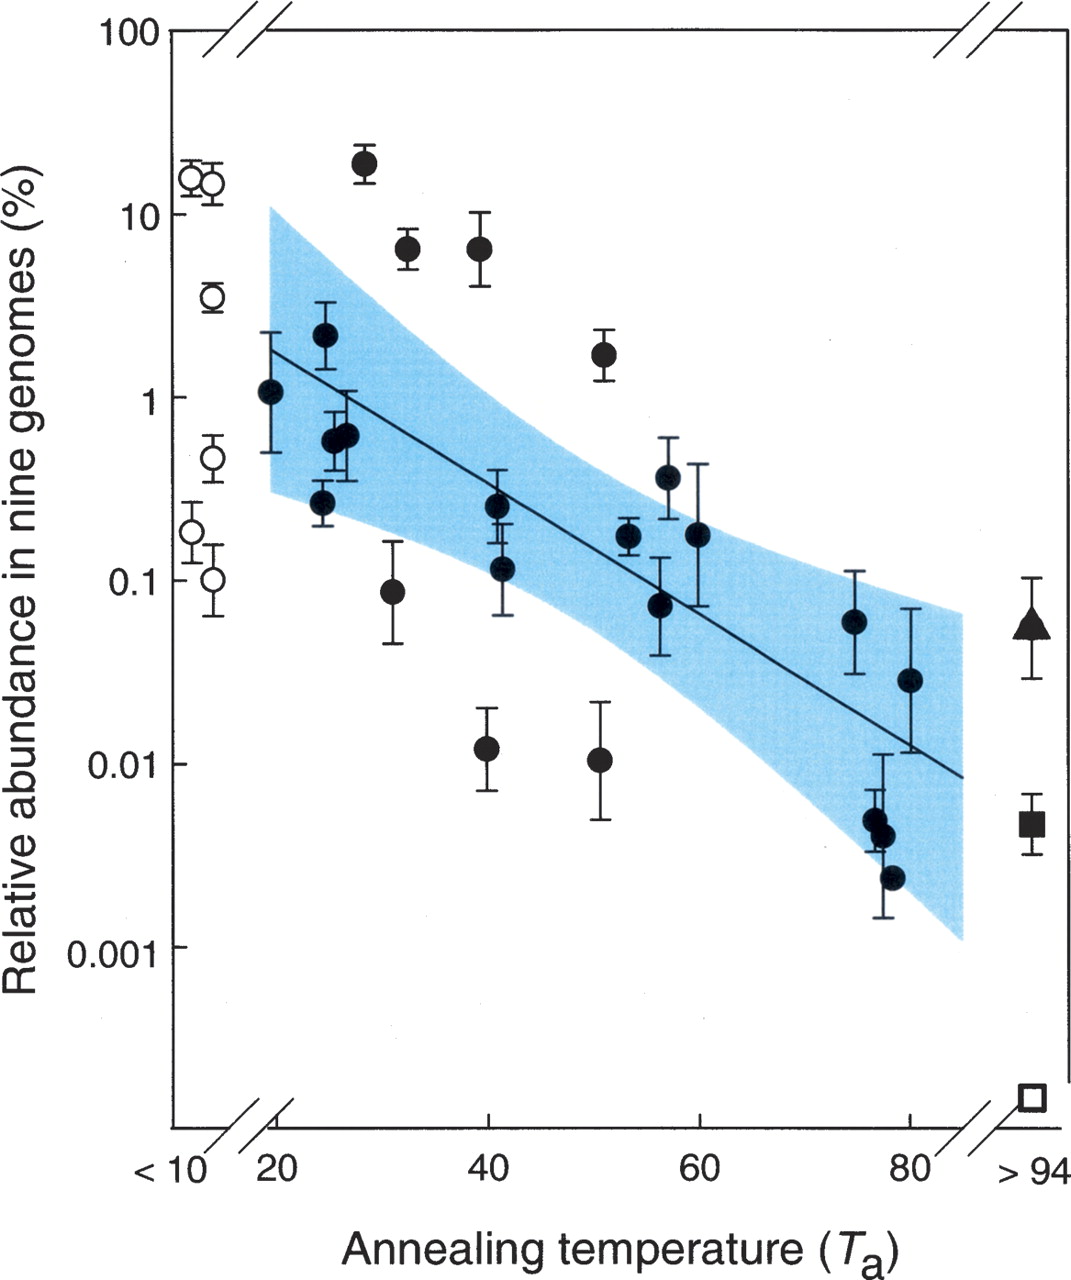
Correlation between Ta and tetraNR abundance in nine vertebrate genomes. Each of the 33 symbols represents one of the unique tetraNR sequences listed in Table 1 (column 2). For each sequence, the Ta (x-axis) is given by the highest value found for either the forward (column 4) or the reverse (column 7) oligonucleotide, whereas the relative abundance (y-axis) is the log of the mean fraction found for each tetraNR sequence relative to the total number of tetraNRs ≥8 units in the nine vertebrate genomes listed in Methods. The (solid line) regression was calculated only for those (solid circles) tetraNR sequences for which either the forward or reverse oligonucleotides displayed a Ta value within the measurable temperature range (10°C to 94°C). (Vertical lines) Standard errors; (blue) 99% confidence interval; (open circles) tetraNRs devoid of temperature-dependent structural transitions; (filled square) CGGG and (filled triangle) TGGG are tetraNRs with Ta values >94°C; (open square) CCGG with a Ta value of >94°C but not present in any genome.


