
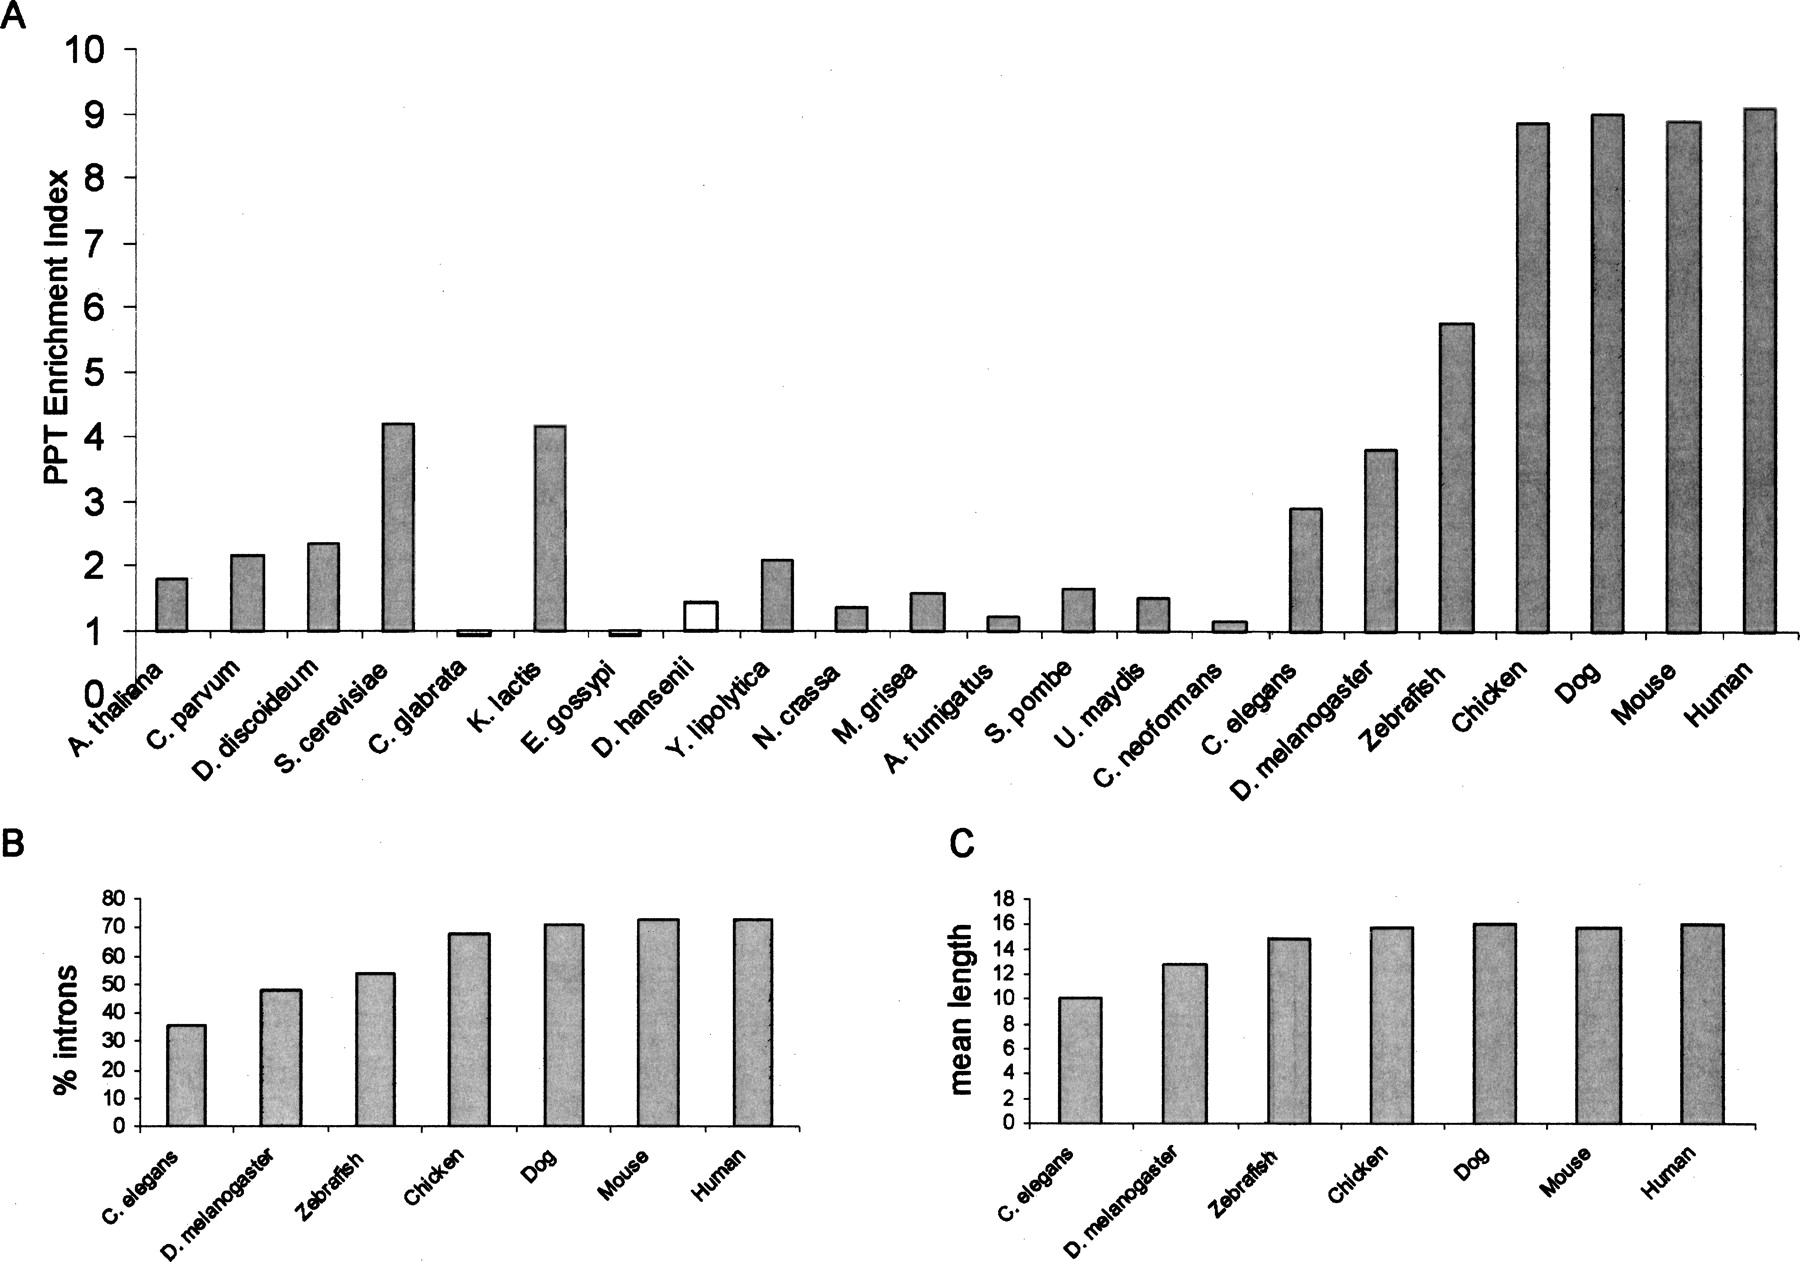
Figure 4.
Comparison of the PPT strengths. (A) The PPT enrichment index indicates the extent of increase in PPT strength in the intron data set, relative to the PPT strength obtained in a corresponding, randomly permuted data set of equal nucleotide composition. Nonsignificant PPT enrichment indexes in C. glabrata, E. gossypi, and D. hansenii are plotted in white. (B) Percentage of introns in which PPTs were detected in metazoans. (C) Mean length of the detected PPTs in metazoans.


