
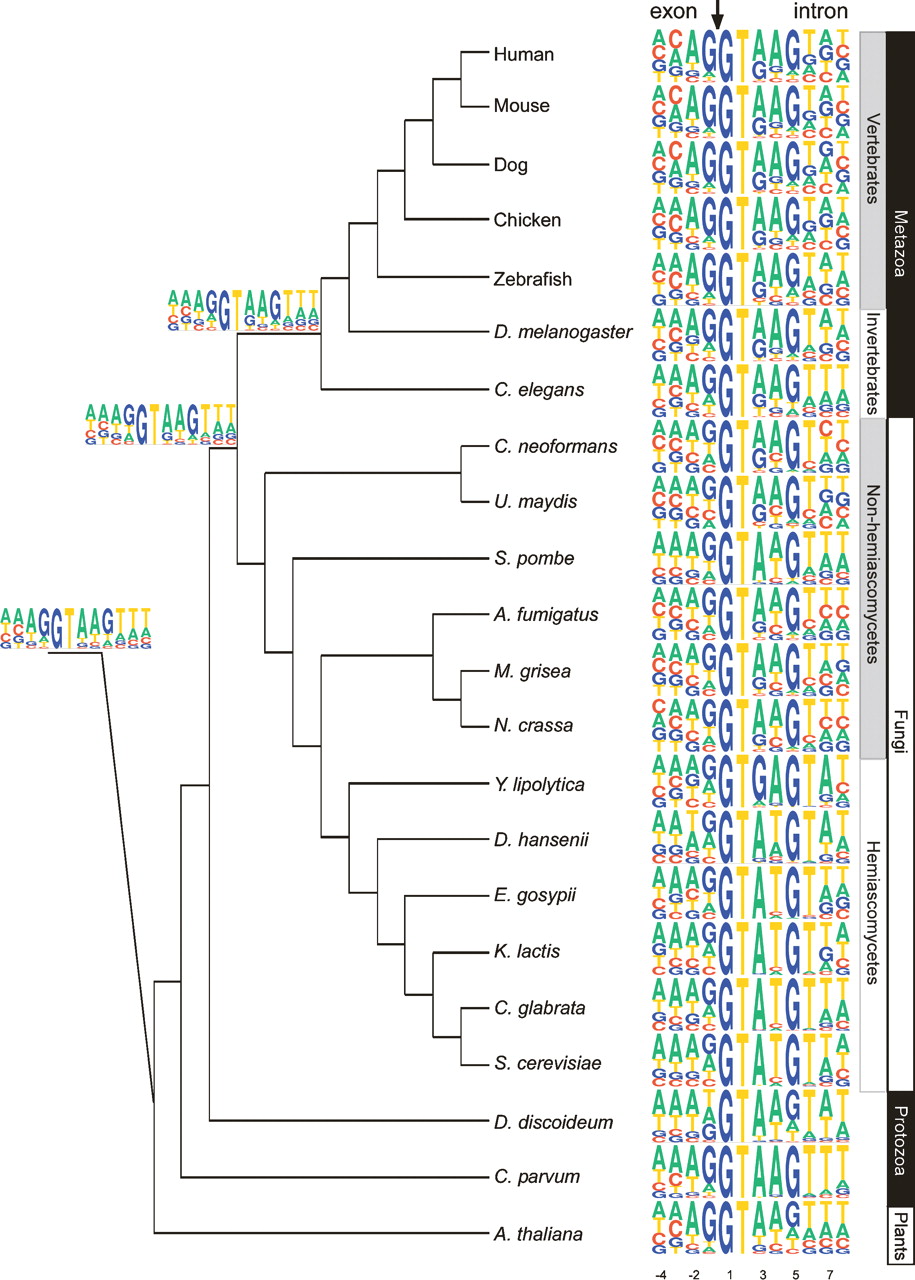
Sequence motifs of the 5′ss. The sequence motif of the 5′ss of each of the 22 organisms is displayed by using the PICTOGRAM program. The height of each letter is proportional to the frequency of the corresponding base at the given position, and bases are listed in descending order of frequency from top to bottom. The displayed sequence spans the exon-intron junction and includes the last four exonic nucleotides and the first eight intronic nucleotides (positions shown at the bottom). The arrow at the top marks the exon-intron junction. The organisms are displayed according to their phylogenetic grouping based on trees developed by Hedges (2002), Dujon (2006), and James et al. (2006). The eukaryotic kingdoms comprising these organisms, as well as phylogenetic subdivisions of these kingdoms, are plotted to the right of the sequence motifs. Sequence motifs of three major ancestral nodes, reconstructed by means of a maximum parsimony-based algorithm, are shown to the left of the tree. The top, middle, and bottom motifs represent the reconstructed sequences of the common ancestor of all metazoans, of all fungi and metazoans, and of all eukaryotes, respectively.


