
A selection of SNPs at 5′ss
Click on table to view larger version.
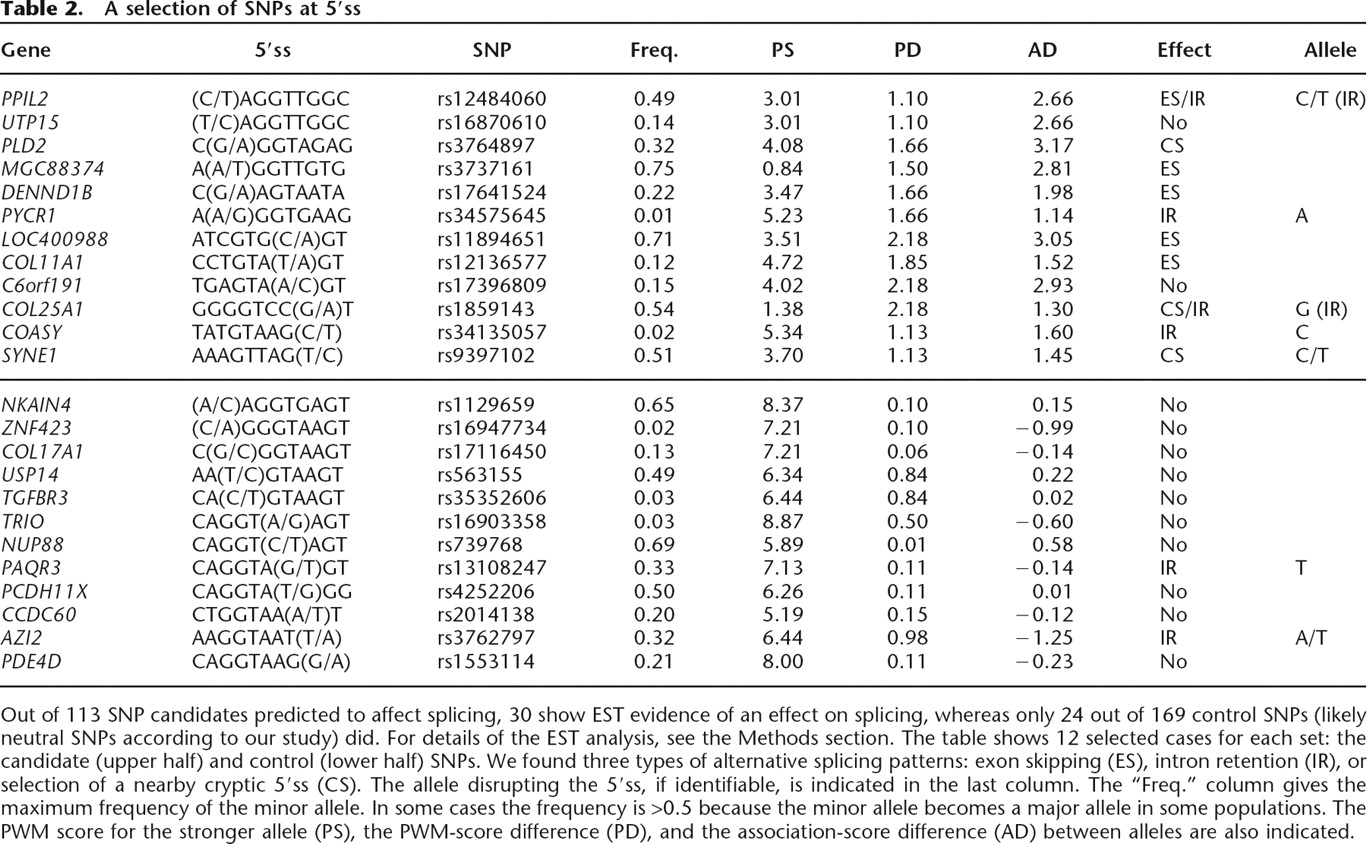
Out of 113 SNP candidates predicted to affect splicing, 30 show EST evidence of an effect on splicing, whereas only 24 out of 169 control SNPs (likely neutral SNPs according to our study) did. For details of the EST analysis, see the Methods section. The table shows 12 selected cases for each set: the candidate (upper half) and control (lower half) SNPs. We found three types of alternative splicing patterns: exon skipping (ES), intron retention (IR), or selection of a nearby cryptic 5′ss (CS). The allele disrupting the 5′ss, if identifiable, is indicated in the last column. The “Freq.” column gives the maximum frequency of the minor allele. In some cases the frequency is >0.5 because the minor allele becomes a major allele in some populations. The PWM score for the stronger allele (PS), the PWM-score difference (PD), and the association-score difference (AD) between alleles are also indicated.


