
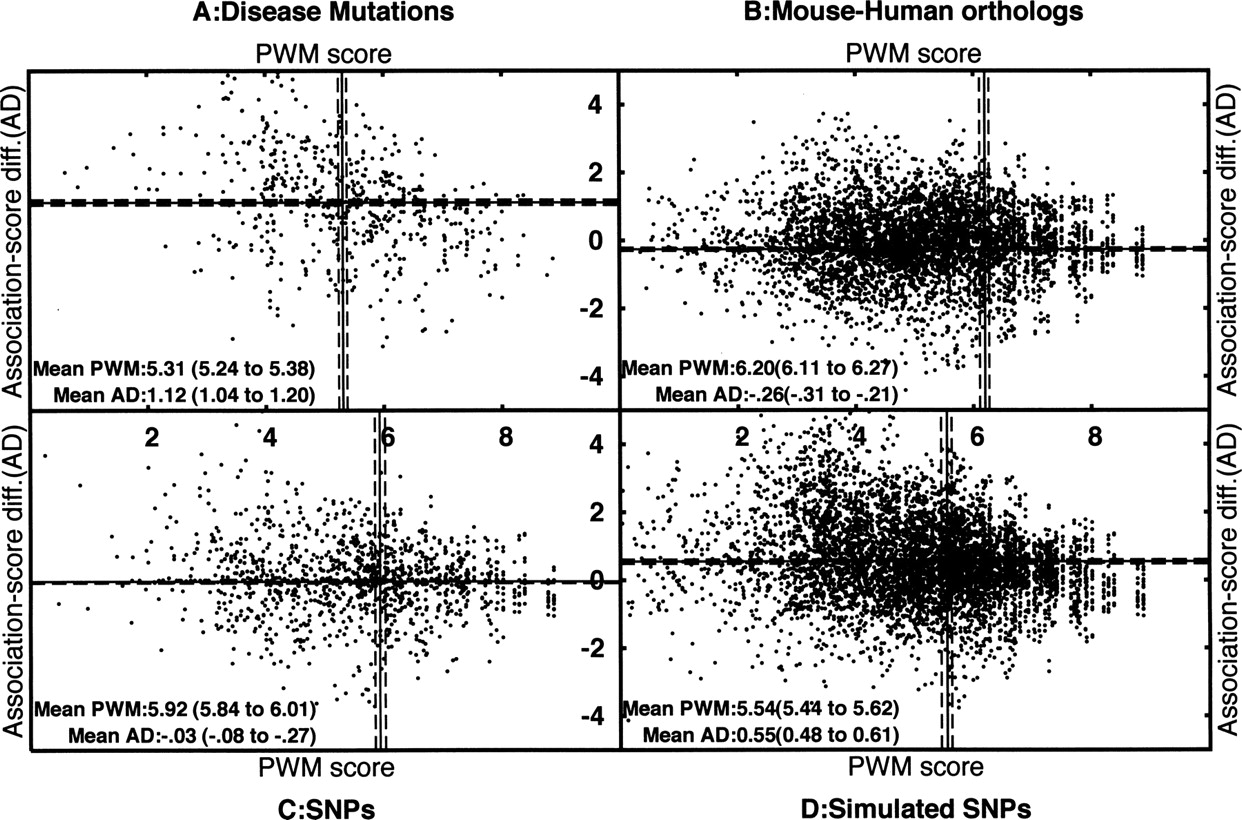
Scatter plots showing combinations of PWM scores (X-axis) and association-score differences (Y-axis) for 5′ss from four data sets. The four data sets are disease-causing mutations (A, 595 cases), orthologous mouse–human pairs of 5′ss (B, 19,940 pairs), SNPs at 5′ss (C, 1260 SNPs), and simulated SNPs at 5′ss (D, 8074 cases). Each spot in the data set corresponds to a 5′ss and a single-nucleotide change to the 5′ss. In each data set, along the X-axis, we plotted the original 5′ss PWM score; in the case of SNPs and orthologous 5′ss, the 5′ss with the higher score is considered the original 5′ss. Along the Y-axis, we plotted the difference in association scores due to the change (score of original pair − score of new pair). A change to a pair with reduced association score will give a positive score difference, and an increase in association score will give a negative value. The solid lines show the averages along the X- and Y-axes, whereas the dashed lines show the confidence intervals for the means (calculated by a bootstrap method). The numbers are also given as text within the plots, with the confidence interval shown in parentheses. The disease panel is clearly biased toward low PWM scores and greater disruption of associations, compared with the other data sets. The averages for the four data sets are well separated on the basis of the confidence intervals.


