
Figure 1.
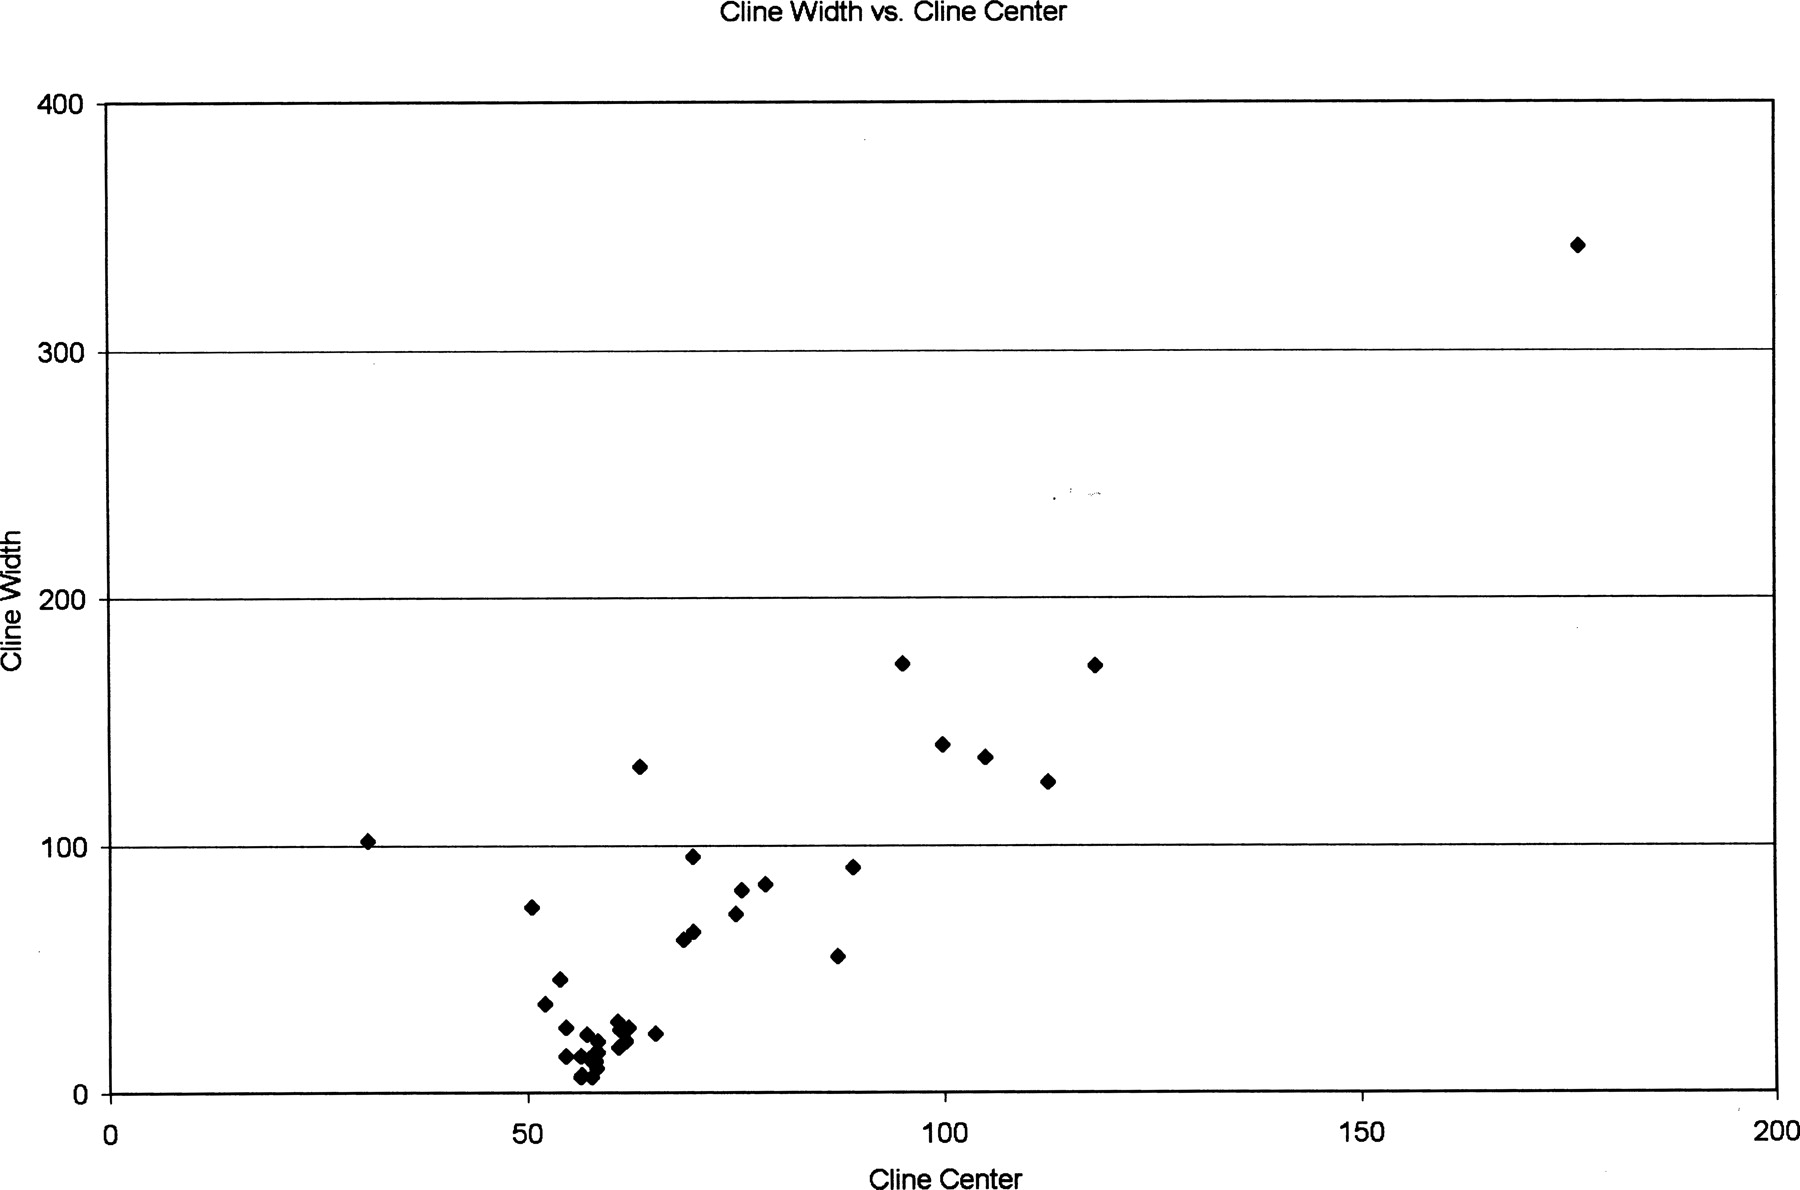
Plot of cline width vs. cline center. These data were generated from two-parameter models of cline shape for 39 autosomal markers.
(Downloading may take up to 30 seconds. If the slide opens in your browser, select File -> Save As to save it.)
Click on image to view larger version.
Plot of cline width vs. cline center. These data were generated from two-parameter models of cline shape for 39 autosomal markers.
 CiteULike
 Delicious
 Digg
Digg Facebook
 Google+
 Reddit
 Twitter
