
Table 4.
Summary of known and novel motifs identified in each tissue using a relative conservation metric and a balanced misclassification metric
Click on table to view larger version.
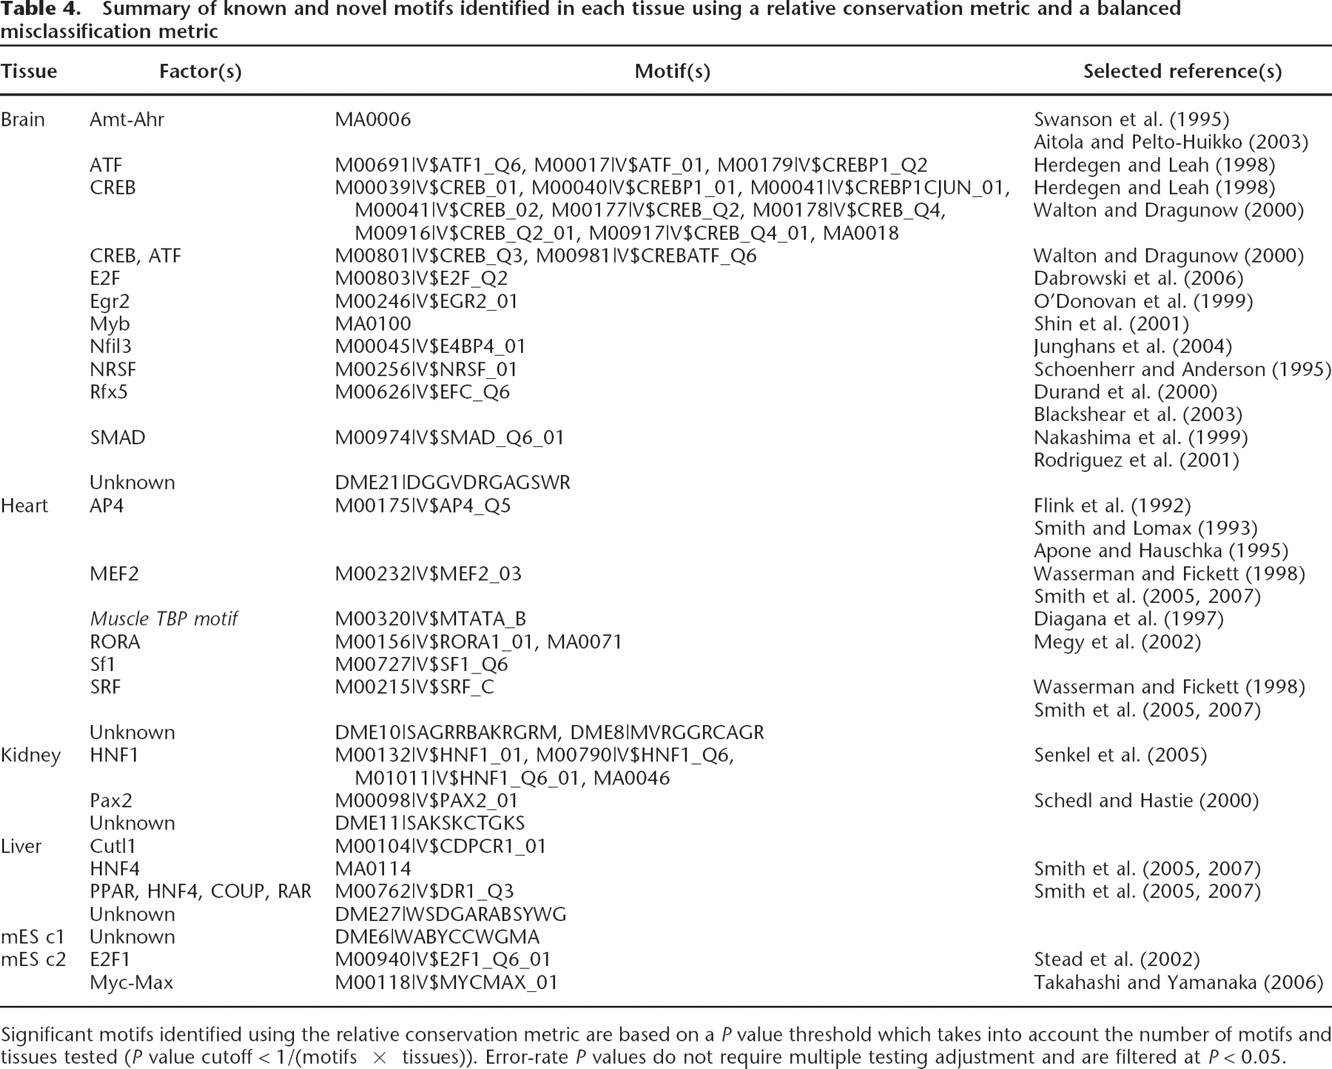
Significant motifs identified using the relative conservation metric are based on a P value threshold which takes into account the number of motifs and tissues tested (P value cutoff < 1/(motifs × tissues)). Error-rate P values do not require multiple testing adjustment and are filtered at P < 0.05.


