
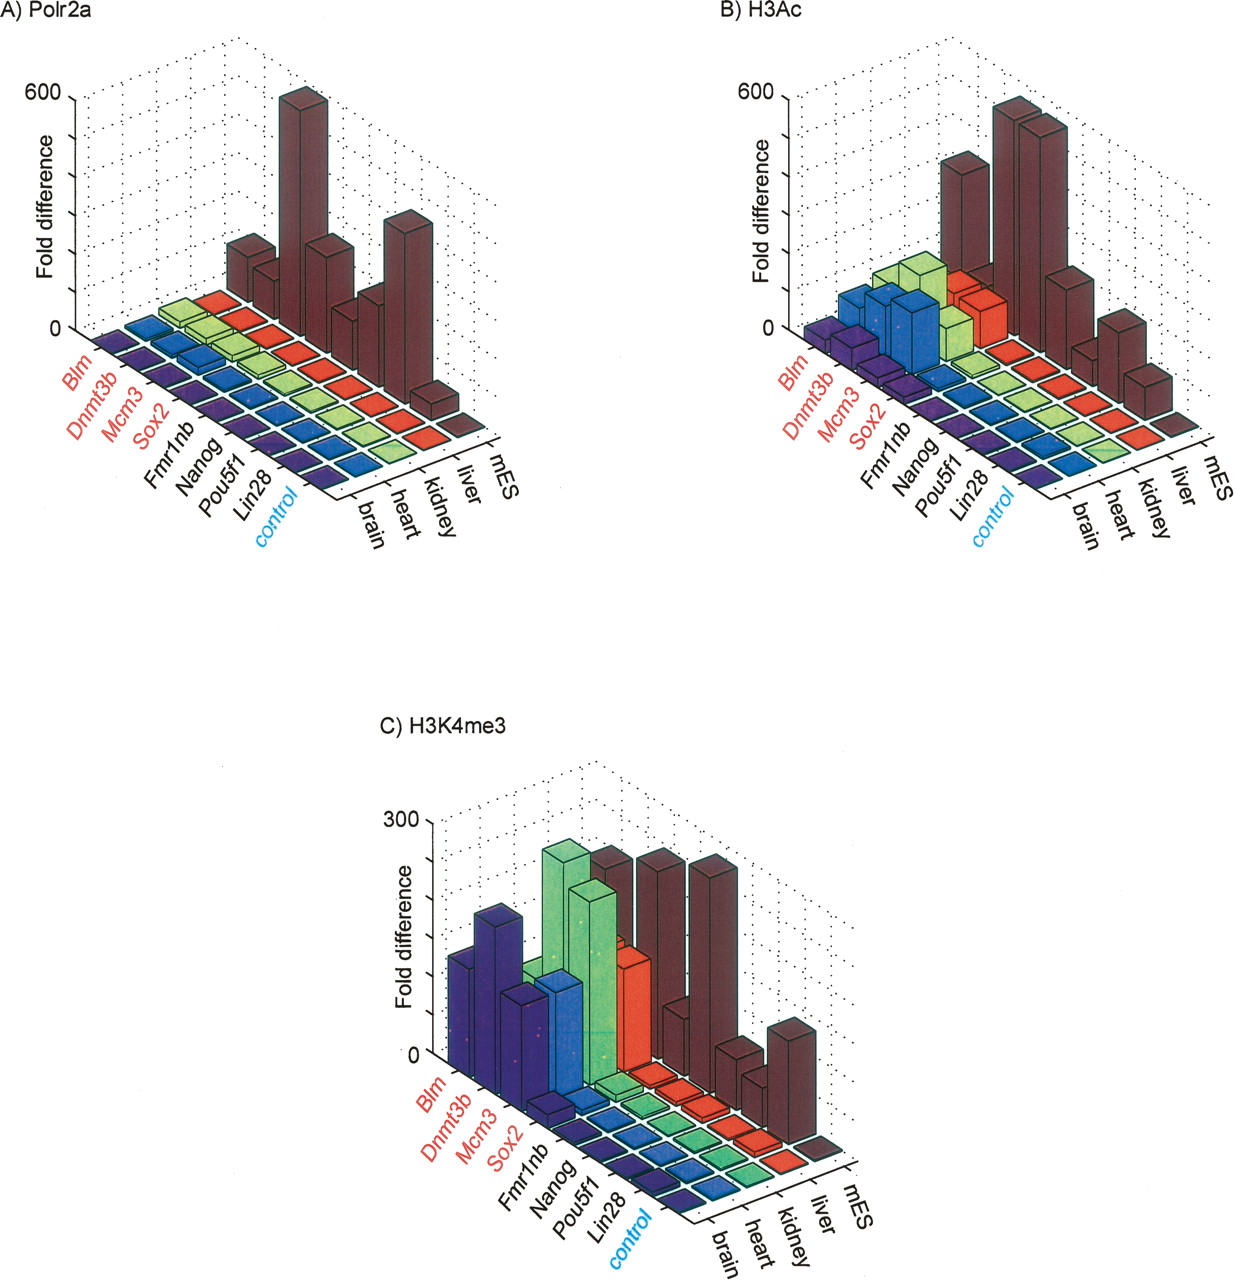
Figure 7.
Validation of mES c1 and c2 promoter classification using ChIP with quantitative PCR. (A) ChIP-qPCR fold difference for Polr2a ChIP DNA relative to input DNA is shown in (Z-axis) for the mES c2 promoters (Y-axis, red), mES c1 promoters (Y-axis, black), and an intergenic control (Y-axis, blue) across the various tissues (X-axis). Similar graphs for (B) H3ac and (C) H3K4me3.


