
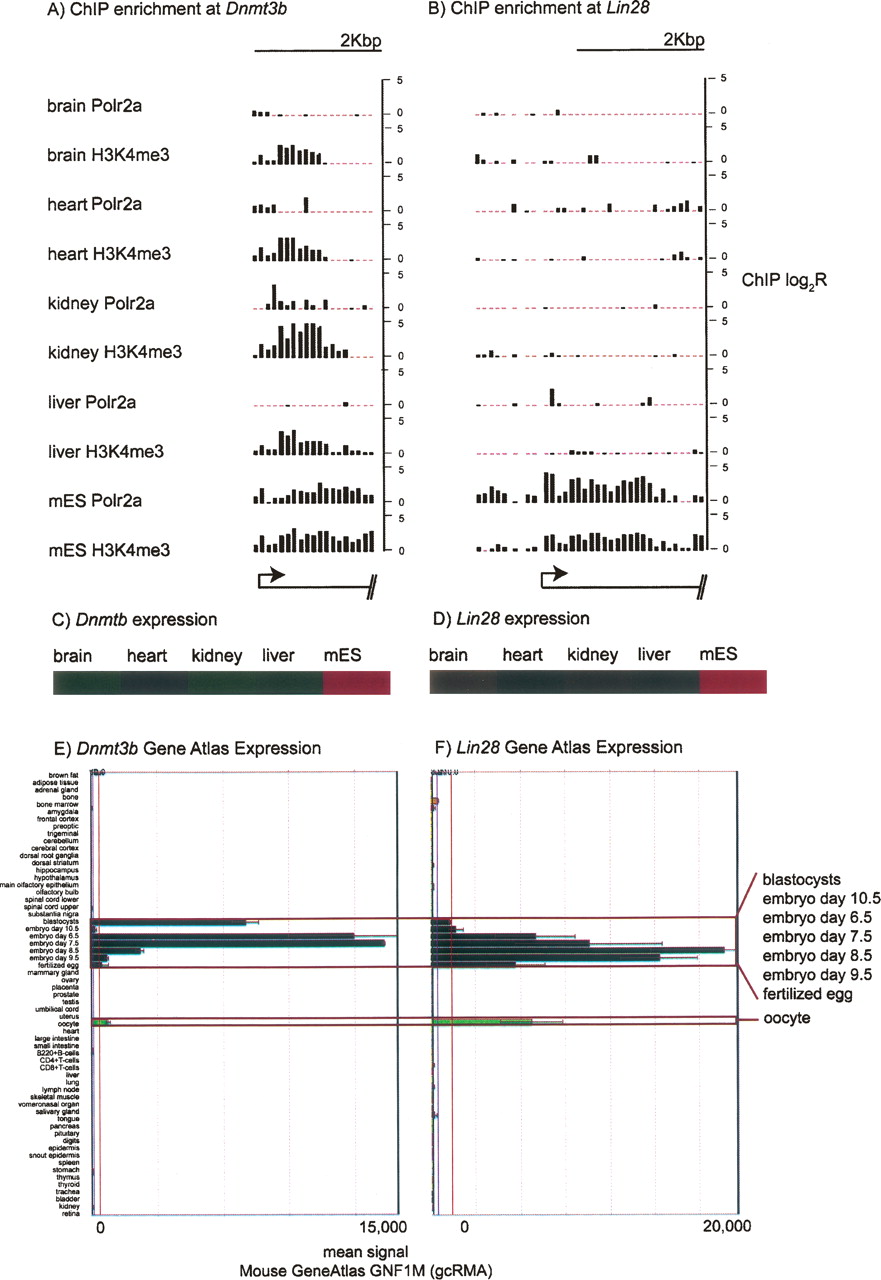
Two examples of mES c1 and mES c2 promoters. (A) Polr2a and H3K4me3 ChIP-chip enrichment across tissues over the Lin28 promoter is shown in a bar graph. The 5′ end position (arrow) and relative gene orientation indicated by transcript schematic at the bottom. Each vertical bar represents the ChIP-chip log2 ratio for the corresponding 50-bp probe. (B) Similar promoter profile for Dnmt3b. (C) Relative expression of Lin28 across the tissues surveyed based on normalized log10 signals from Affymetrix expression profiling. Expression enrichment from low to high is represented by color gradient from green to black to red. (D) Relative expression for Dnmt3b. (E) Lin28 expression across a panel of cell types in the GNF expression atlas (copyright GNF). Each horizontal bar is the normalized signal for the tissue listed along the Y-axis. (F) Dnmt3b expression across a panel of cell types in the GNF expression atlas (copyright GNF).


