
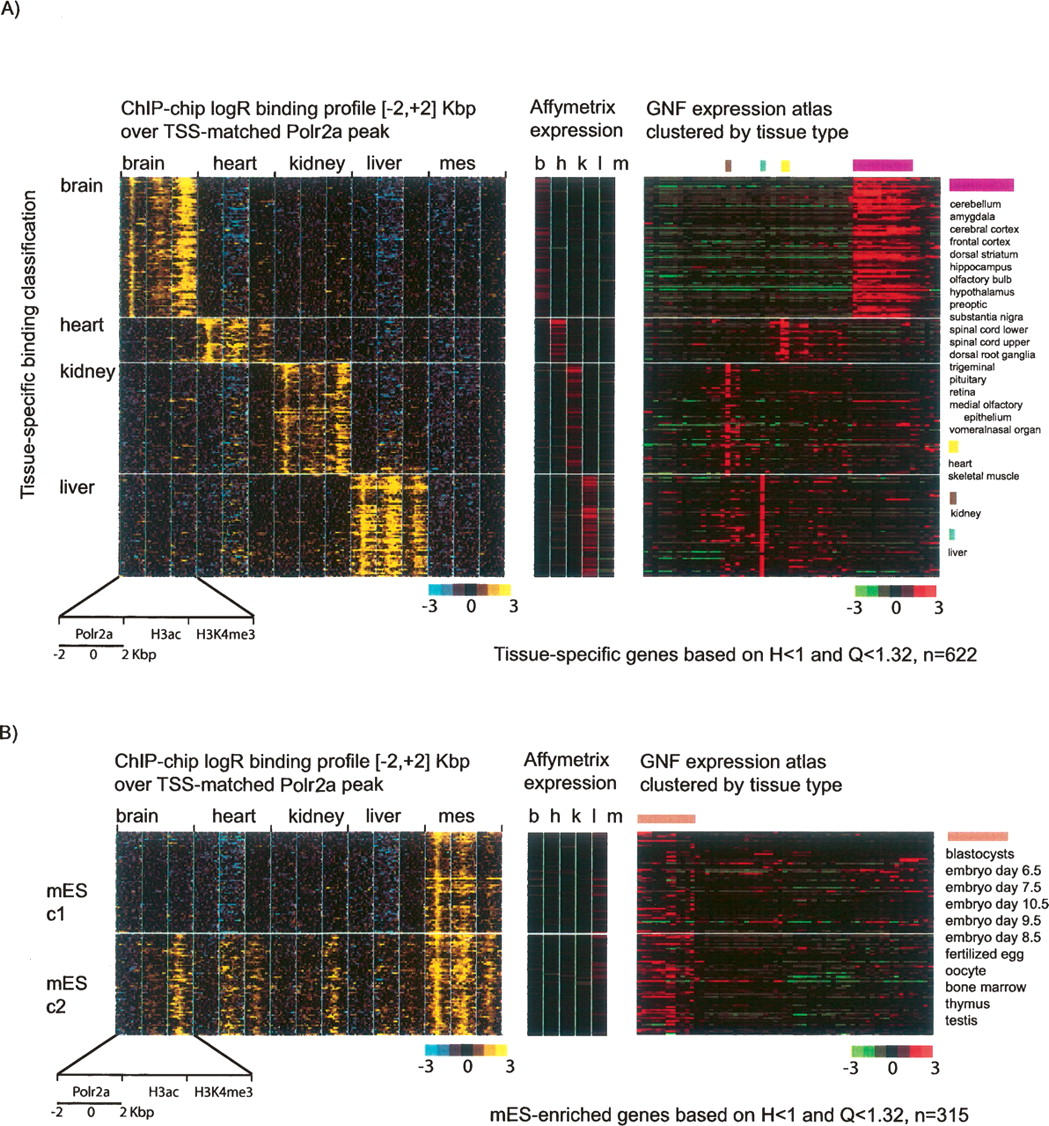
Complex relationship between Polr2a occupancy and active chromatin modifications at the tissue-specific promoters. (A) Polr2a occupancy and chromatin modification profiles at brain, heart, kidney, or liver specific promoters are shown in black–yellow pseudocolors. Each row in the left panel is the concatenation of the ChIP-chip log2 ratio profile over a 4-kbp window for Polr2a, H3ac, and H3K4me3 in the corresponding tissue. The window is centered on the peak of Polr2a binding for the tissue-specific promoter. Along the same row for each promoter, the expression levels of the corresponding transcript across the same tissues is shown in red–green pseudocolors in the adjacent panel (middle panel). In addition, the corresponding transcript levels in the 61 tissues profiled in the GNF SymAtlas are also shown (right panel). Rows are grouped according to the tissue-specific classification (brain, heart, kidney, or liver) of the promoter based on Polr2a binding. (B) Polr2a binding, chromatin modifications, and expression profiles are shown for mES-specific promoters. Note that two classes of mES-specific promoters can be seen with distinct chromatin modification profiles in adult tissues. While both classes are characterized by ES-specific gene-expression profiles (middle and right panel), the chromatin modification states of these promoters are different in adult tissues.


