
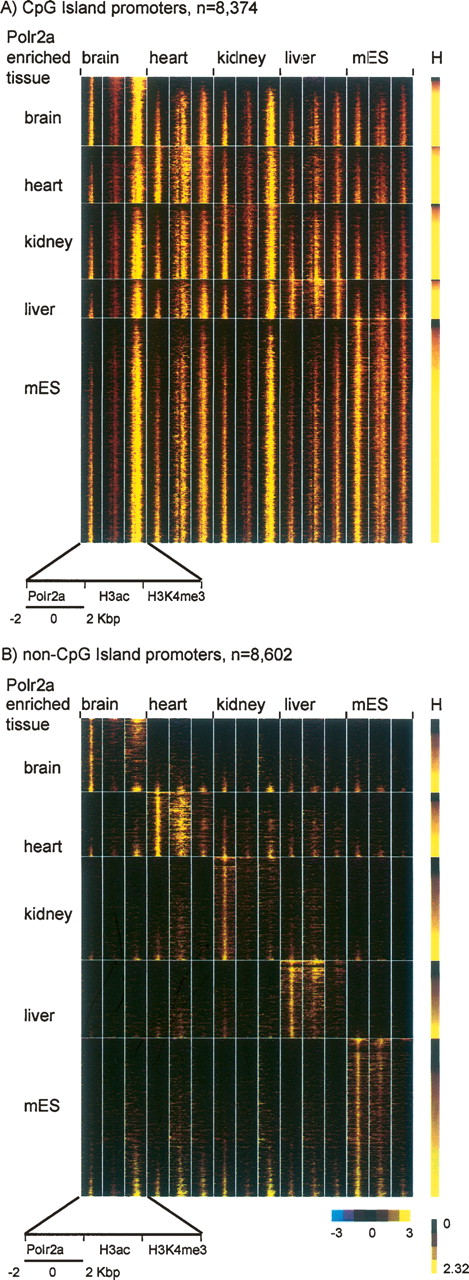
Polr2a binding and chromatin modification states at CpG and non-CpG island promoters across different mouse tissues. (A) ChIP-chip profiles of Polr2a, H3Ac, and H3K4me3 are shown in pseudocolors for CpG island promoters (n = 8374). Each row is the concatenation of the log2-transformed enrichment ratio over a 4-kbp window for Polr2a, H3ac, and H3K4me3 in brain, heart, kidney, liver, and mES. The yellow color indicates high enrichment ratios, while the black indicates no enrichment. The window is centered on the peak of Polr2a binding for the known CpG island promoter identified in these tissues. Rows are grouped according to the tissue with the highest relative Polr2a binding and ordered within each tissue according to the Polr2a entropy score or H (right bar). (B) ChIP-chip profiles of Polr2a, H3Ac, and H3K4me3 are shown for non-CpG island promoters (n = 8602). Note that subtle enrichments of H3ac and H3K4me3 revealed by these promoter profiles across tissues are not likely to be called “present” by typical ChIP-chip analysis methods.


