
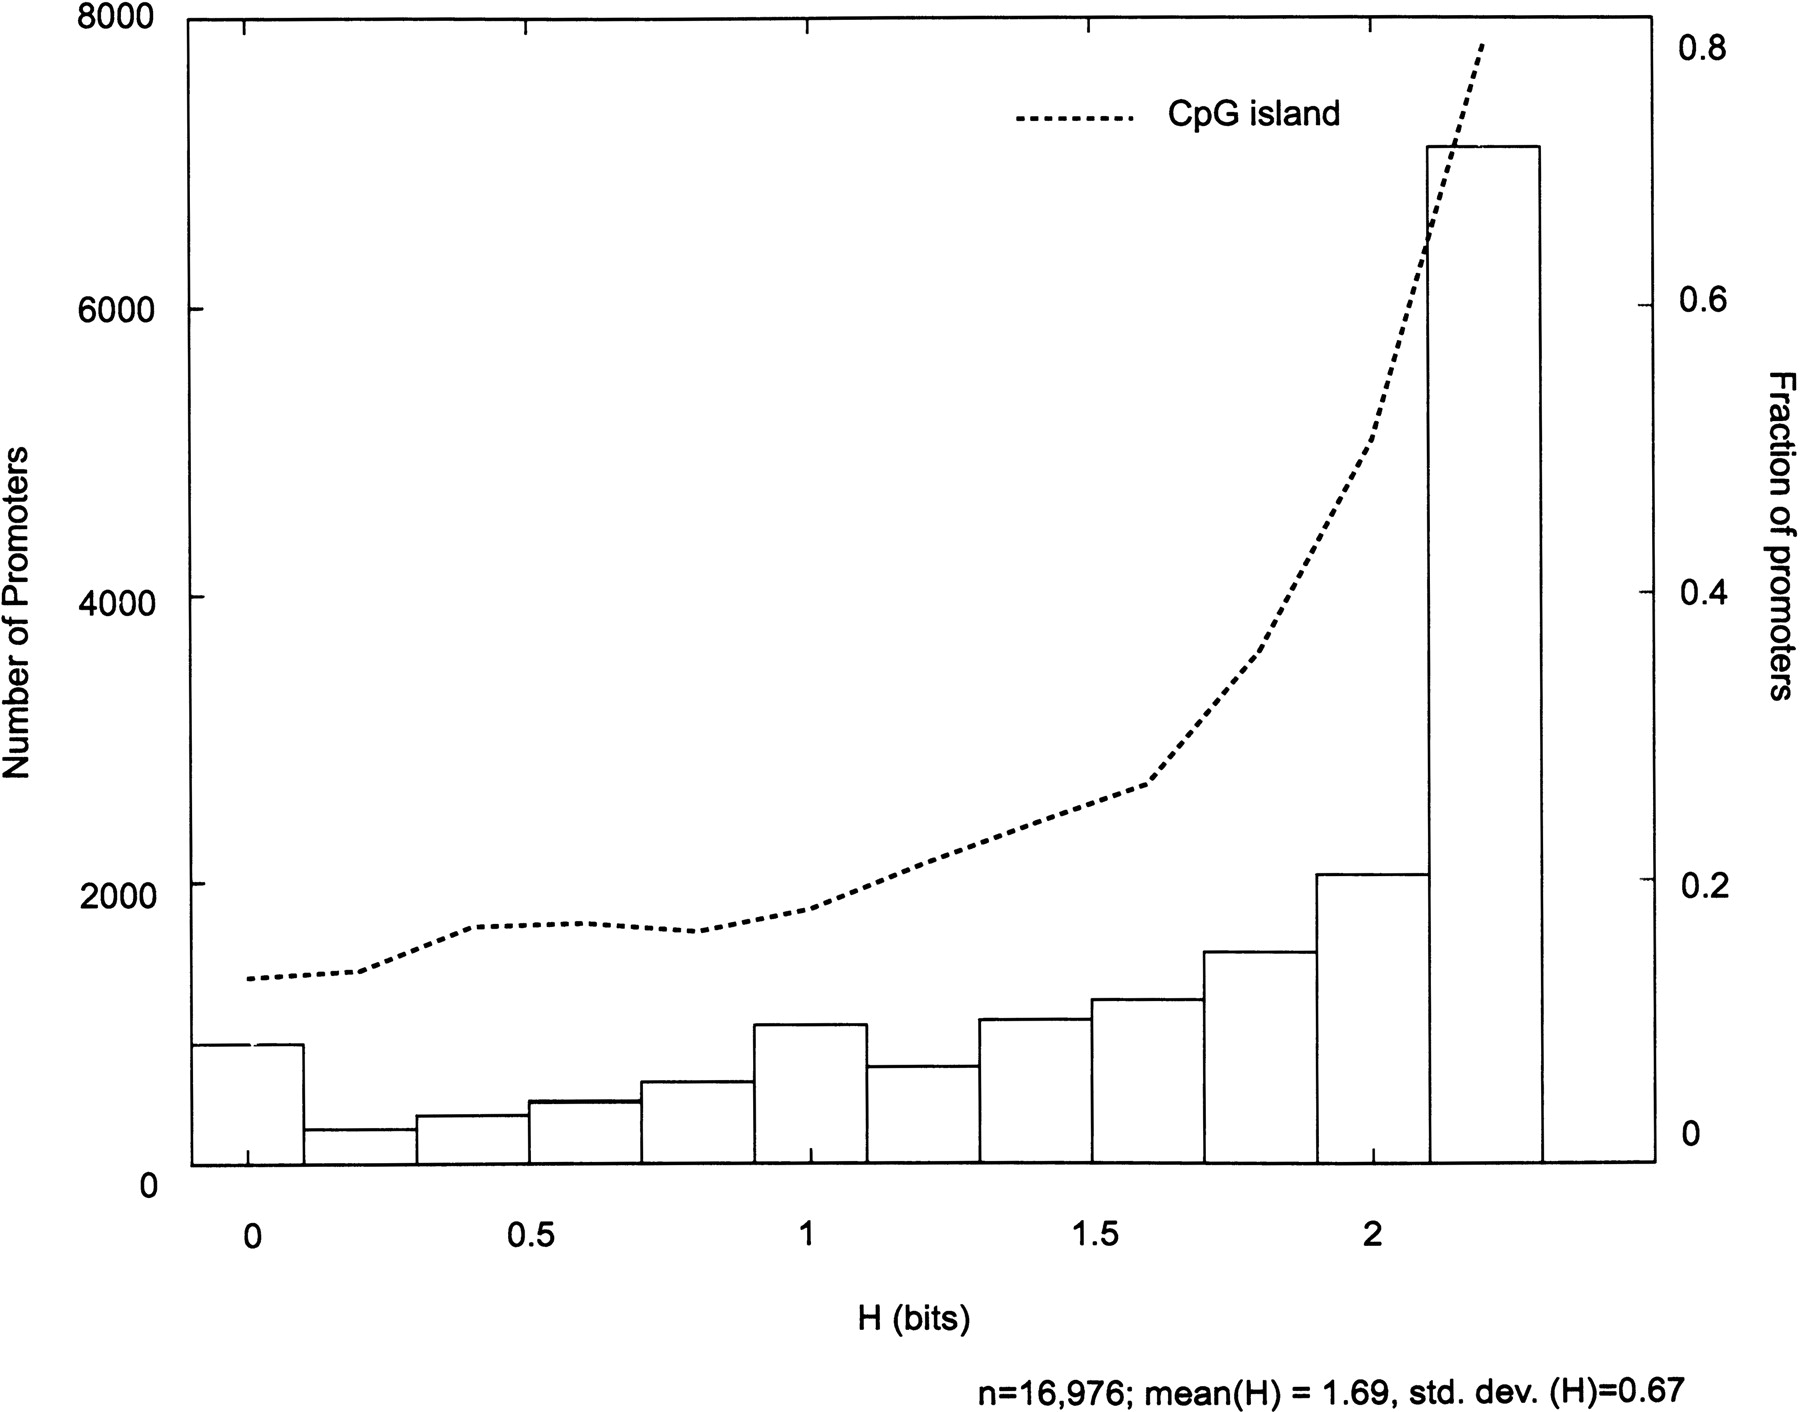
Quantitative index of tissue-specific Polr2a occupancy reveals an inverse relationship between CpG islands and tissue-specific promoter activity. Distribution of known promoters is plotted across a range of tissue-specificity, as measured by Shannon entropy (H) defined based on Polr2a ChIP-chip profiles (see Methods). On the primary Y-axis (left), promoter counts across the different bins (bin size = 0.2 bits) for the range of tissue-specificity values (H), H ∈ [0, log2(N)] are shown. Low values of H indicate tissue-specific expression and the maximal value denotes uniform expression across tissues surveyed. The second axis (right) shows the fraction of promoters within each bin overlapping CpG Islands (dashed line).


