
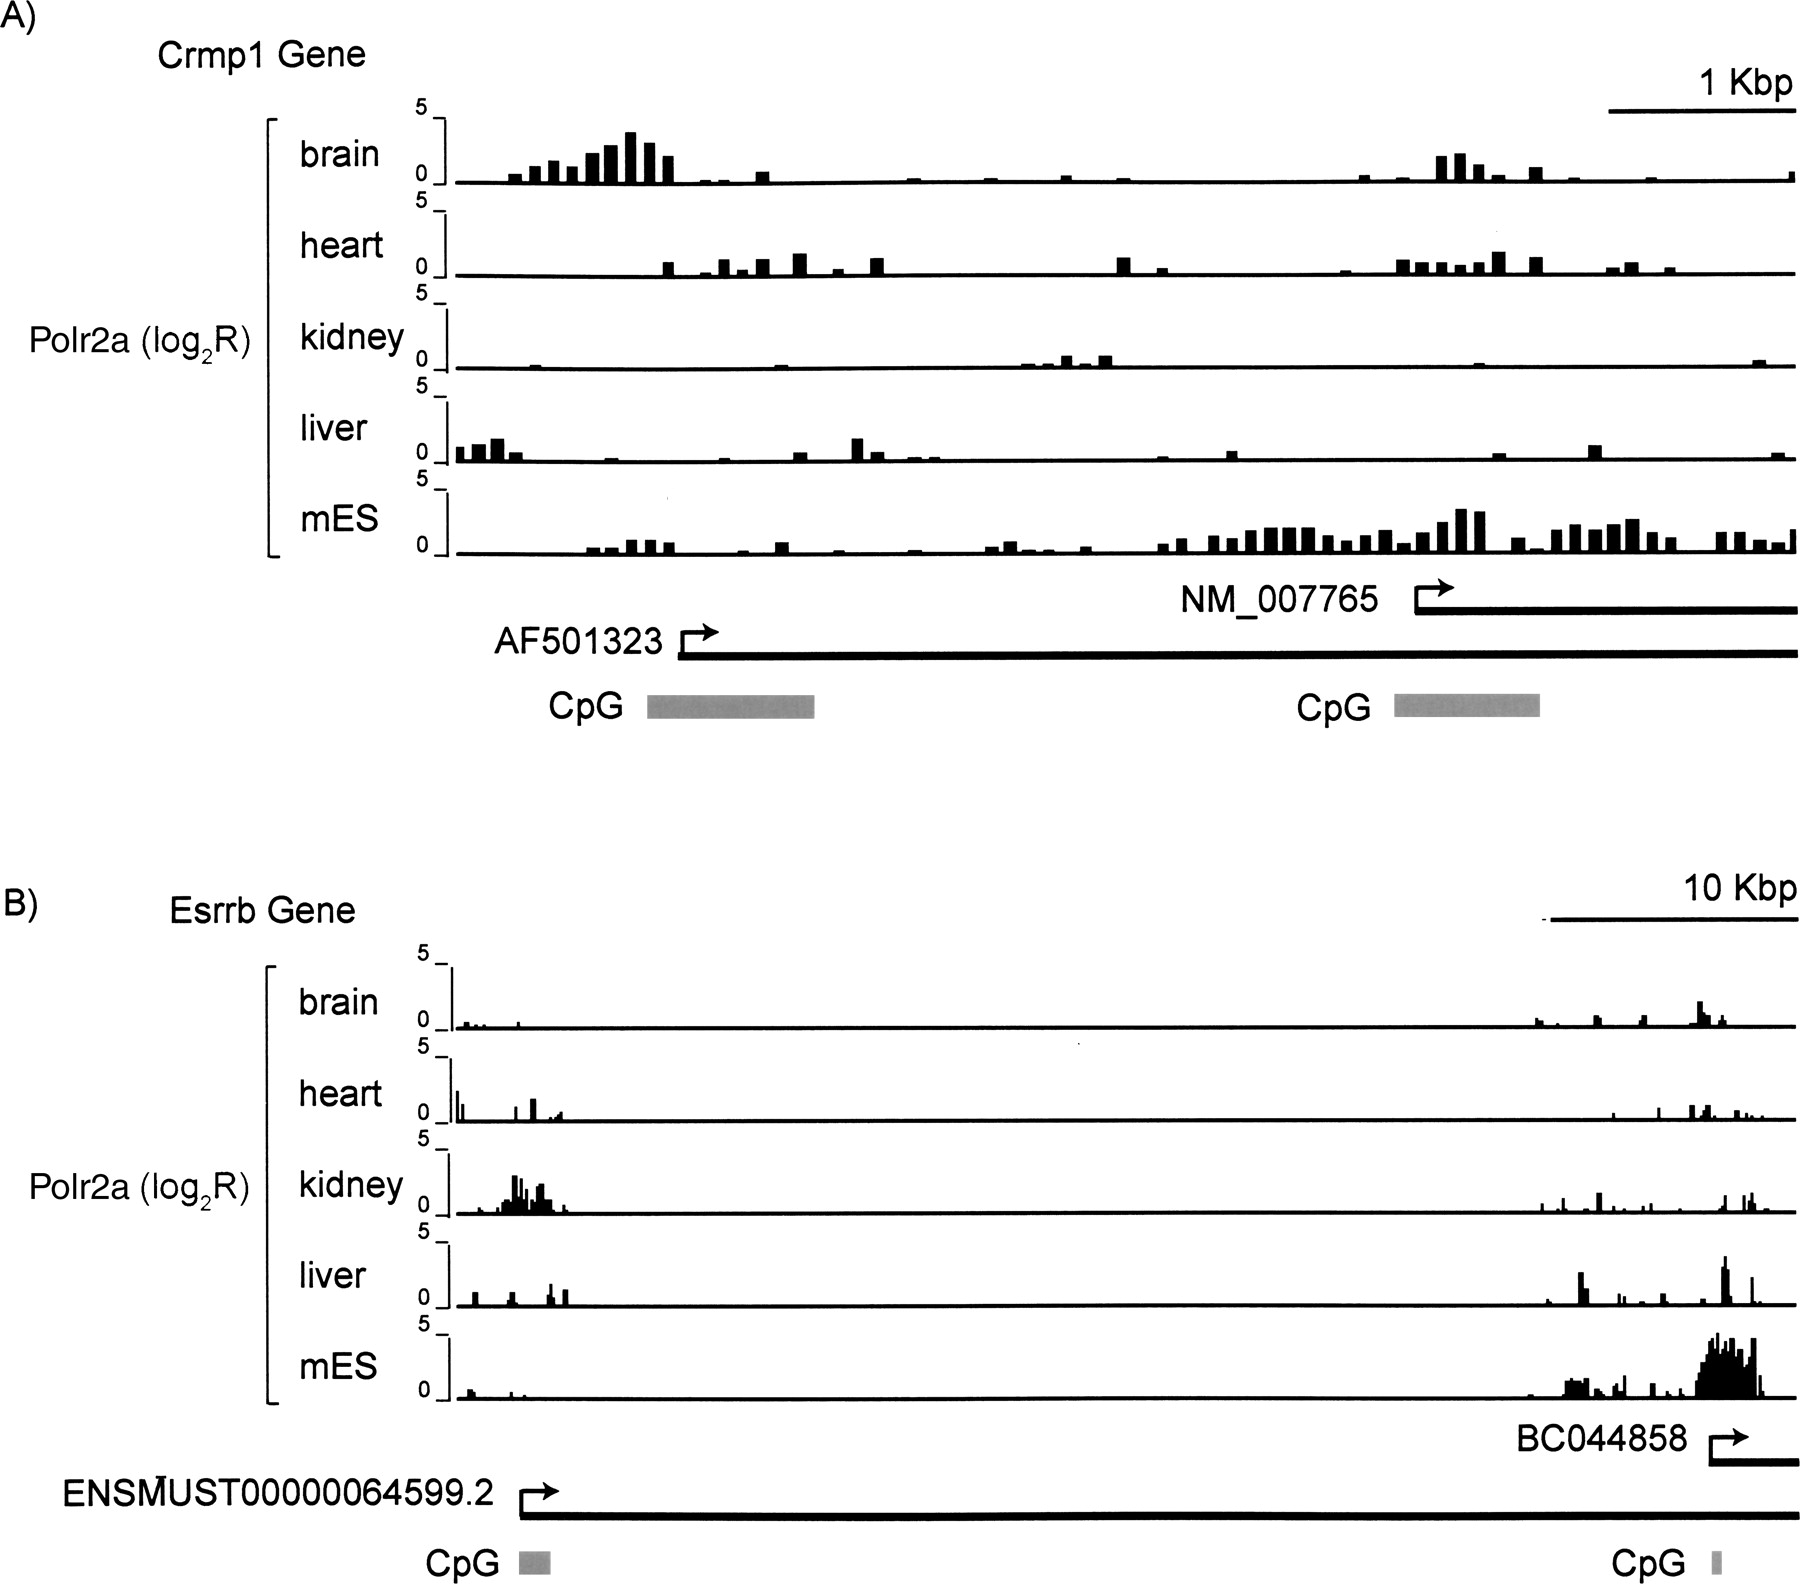
Figure 2.
Polr2a binding profiles reveal alternative promoters usage across tissues. (A) ChIP-chip profiles for Polr2a spanning two alternative promoters for the Crmp1 gene. Each bar represents Polr2a ChIP-chip log2 ratio corresponding to a 50-bp probe. These probes are distributed along the genomic regions at 100-bp end-to-end spacing. (B) Similar Polr2a binding profile for the two alternative promoters of the Esrrb gene.


