
Multiple regression models for log mutability (per locus per generation) of genomewide and local microsatellite groups
Click on table to view larger version.
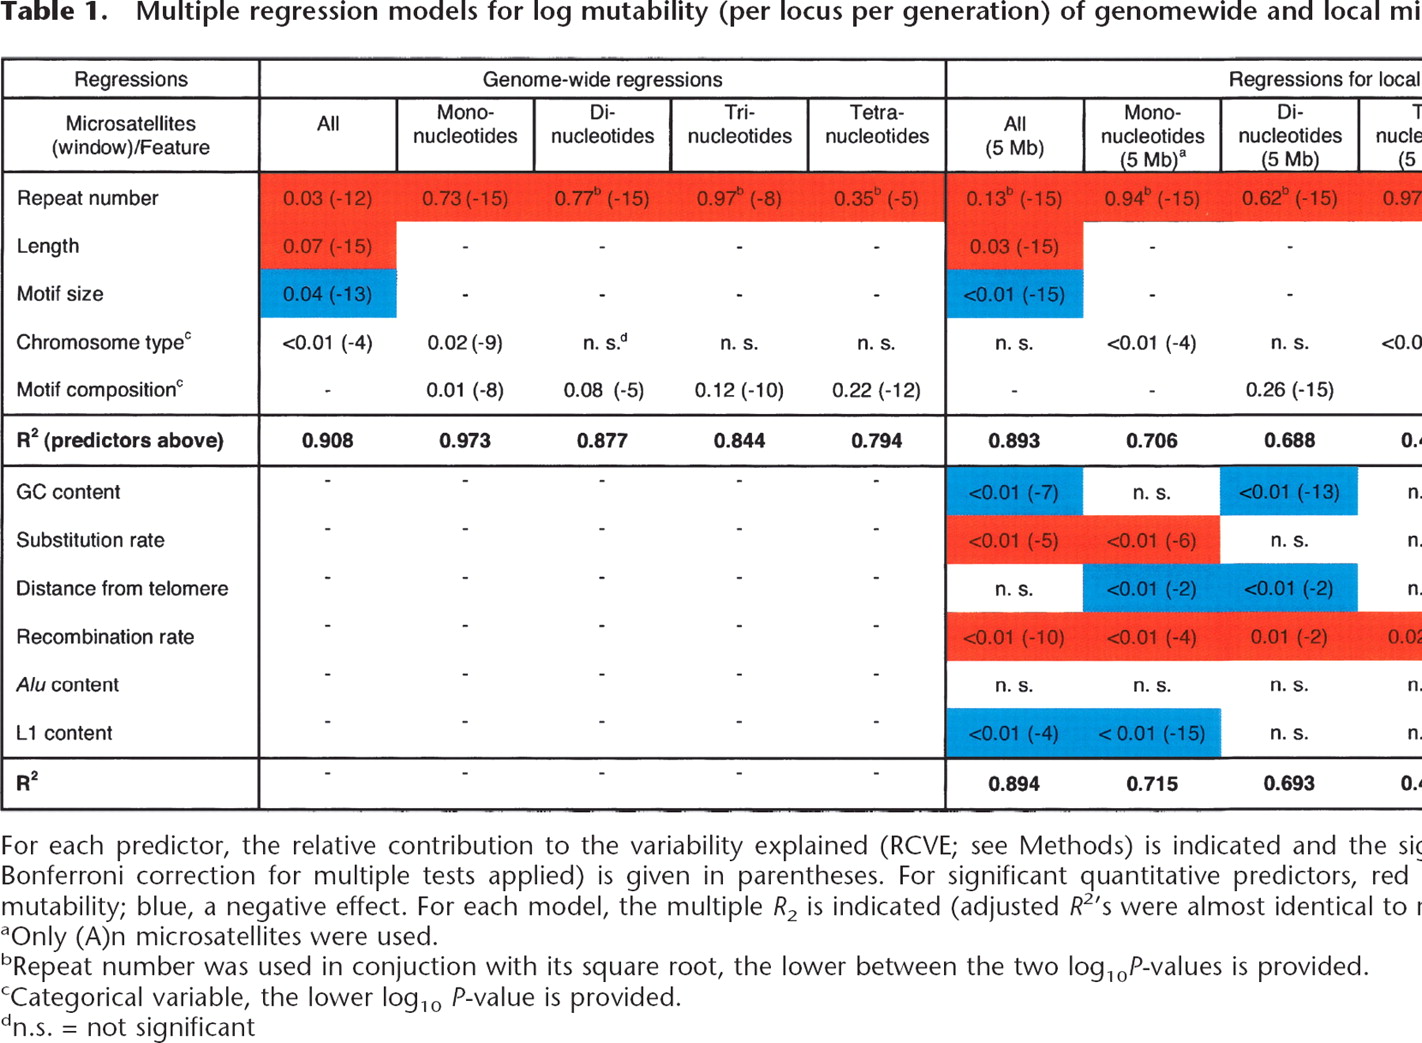
For each predictor, the relative contribution to the variability explained (RCVE; see Methods) is indicated and the significance (log10 P-value with Bonferroni correction for multiple tests applied) is given in parentheses. For significant quantitative predictors, red indicates a positive effect on mutability; blue, a negative effect. For each model, the multiple R2 is indicated (adjusted R2’s were almost identical to multiple R2).
aOnly (A)n microsatellites were used.
bRepeat number was used in conjuction with its square root, the lower between the two log10P-values is provided.
cCategorical variable, the lower log10 P-value is provided.
dn.s. = not significant.


