
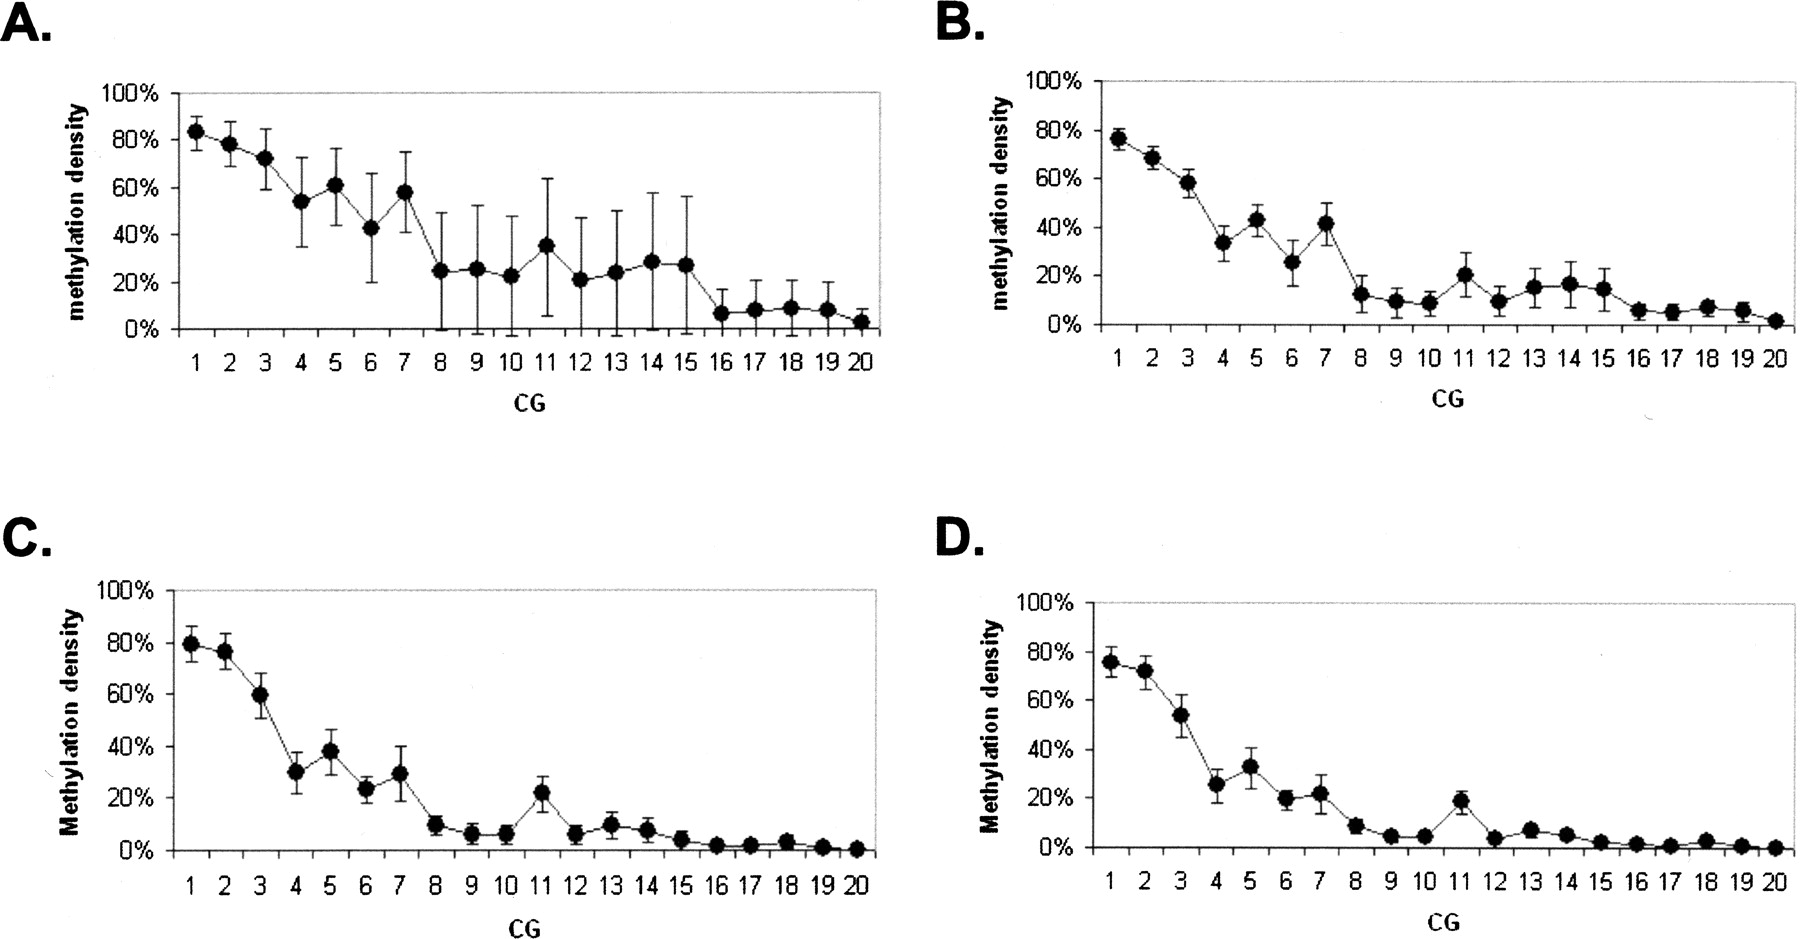
Figure 7.
Variation of methylation density among different samples. The plots show an average methylation density for each CG across MGA locus in tumor samples (A), normal samples (B), and serum samples (C) of cancer patients and of cancer-free individuals (D). X axis represents the arbitrary numbers that reflect the sequential positions of particular CG in the locus. Y axis represents an average methylation density. Error bars represent the range of average methylation density among samples.


