
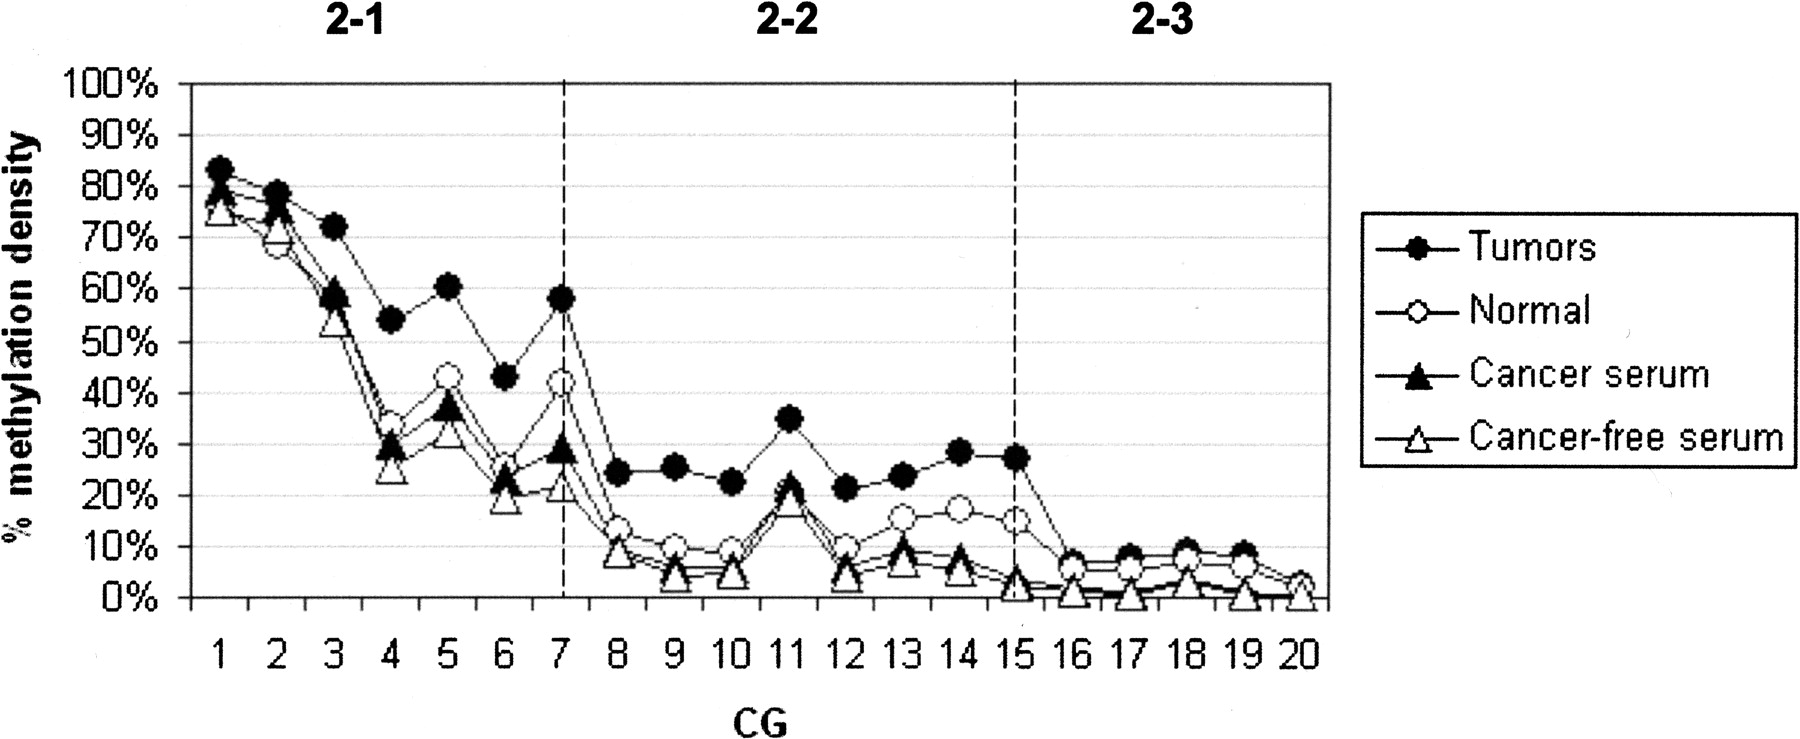
Figure 5.
The stability of methylation pattern of locus MGA in the different samples. The plots show an average methylation density for each CG across the MGA locus in tumor samples (●), normal samples (◦), and serum samples of cancer patients (▴) and of cancer-free individuals (▵). The dashed lines showed the boundary of the amplicons used to generate the data. X axis represents the arbitrary numbers that reflect the sequential positions of particular CG in the locus. Y axis represents an average methylation density.


