
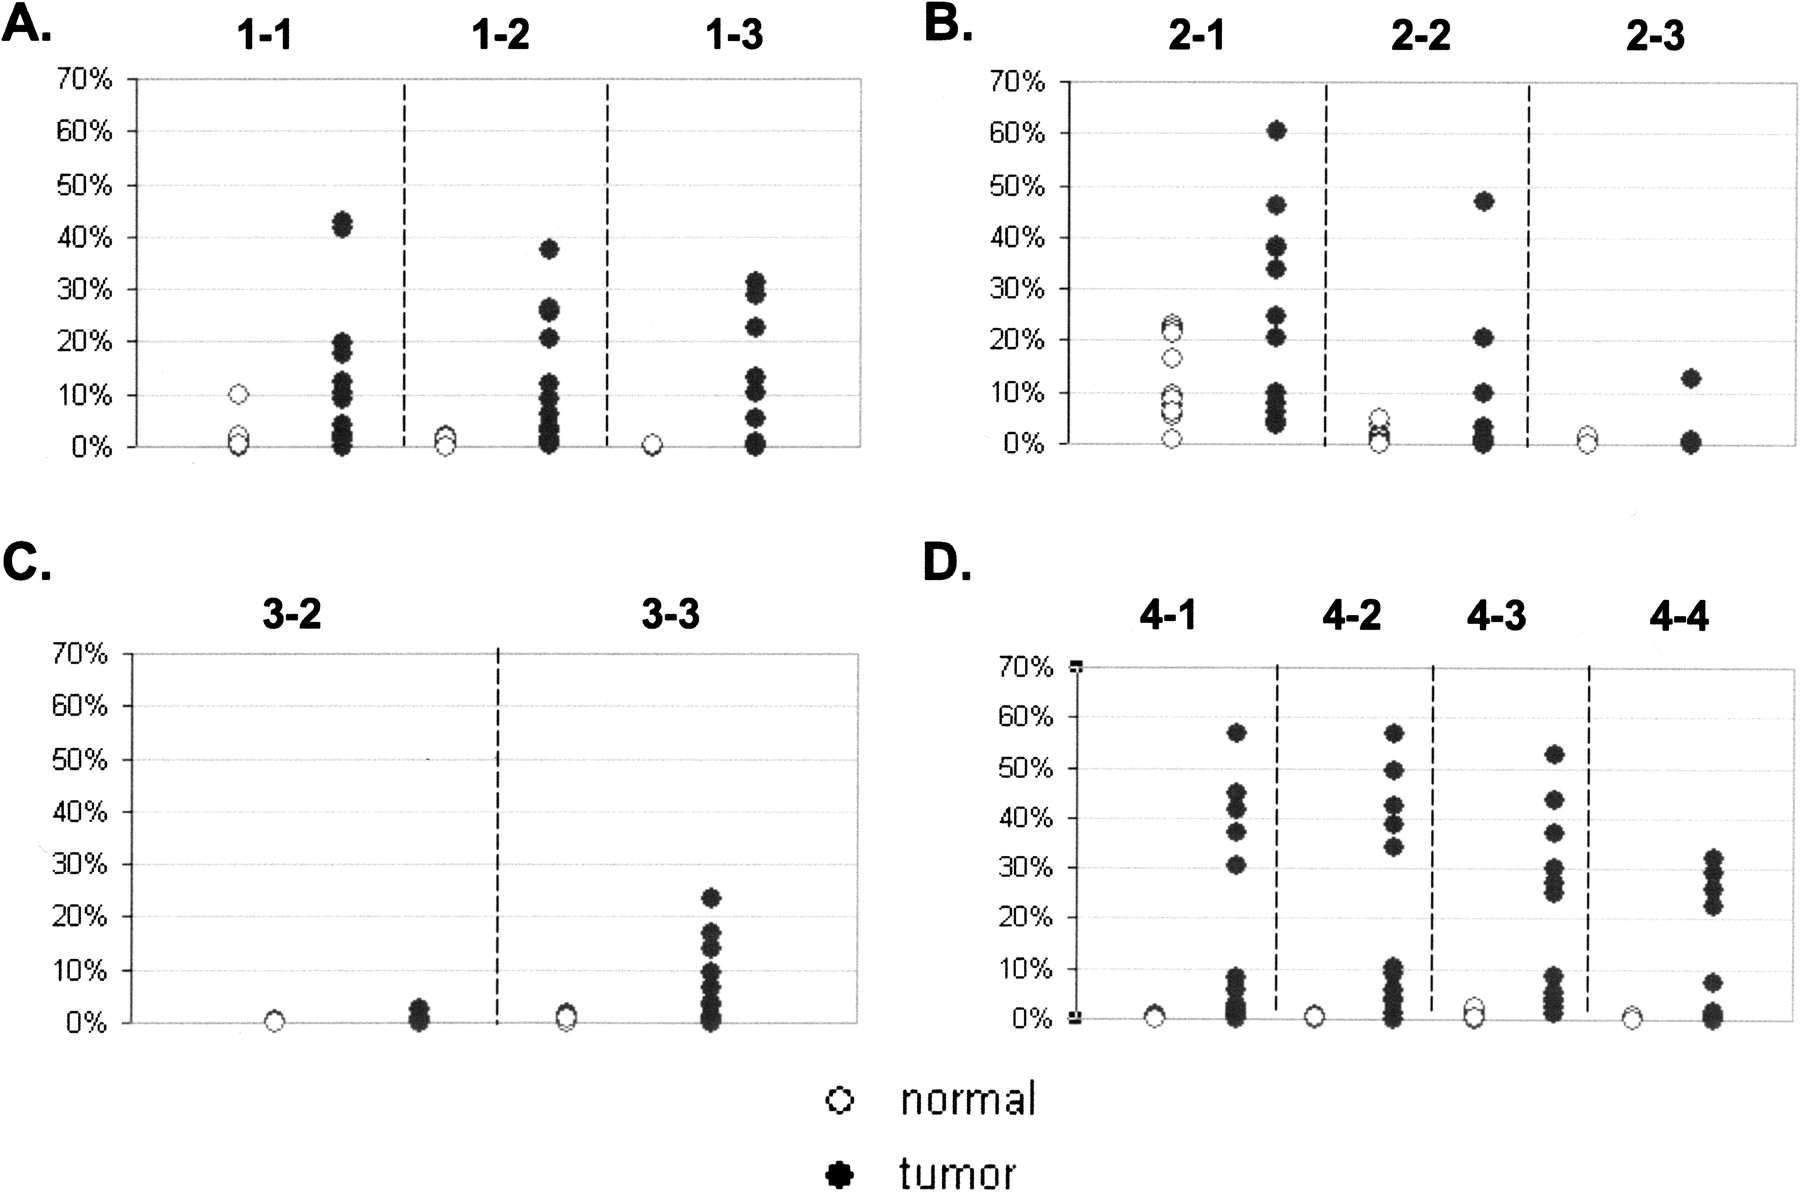
Figure 4.
Percent of FMM in tissue samples. The plots represent detection of FMM in tissue samples for loci GHSR (A), MGA (B), NFX1 (C), and ha1g_00644 (D). Y axis represents percent of FMM from total number of sequenced molecules. The dashed lines separate data obtained from the different amplicons. The numbers on the top of each plot indicate the amplicons that were used to generate the data beneath. (◦) Normal samples; (●) tumor samples. Note that scale is 70%.


