
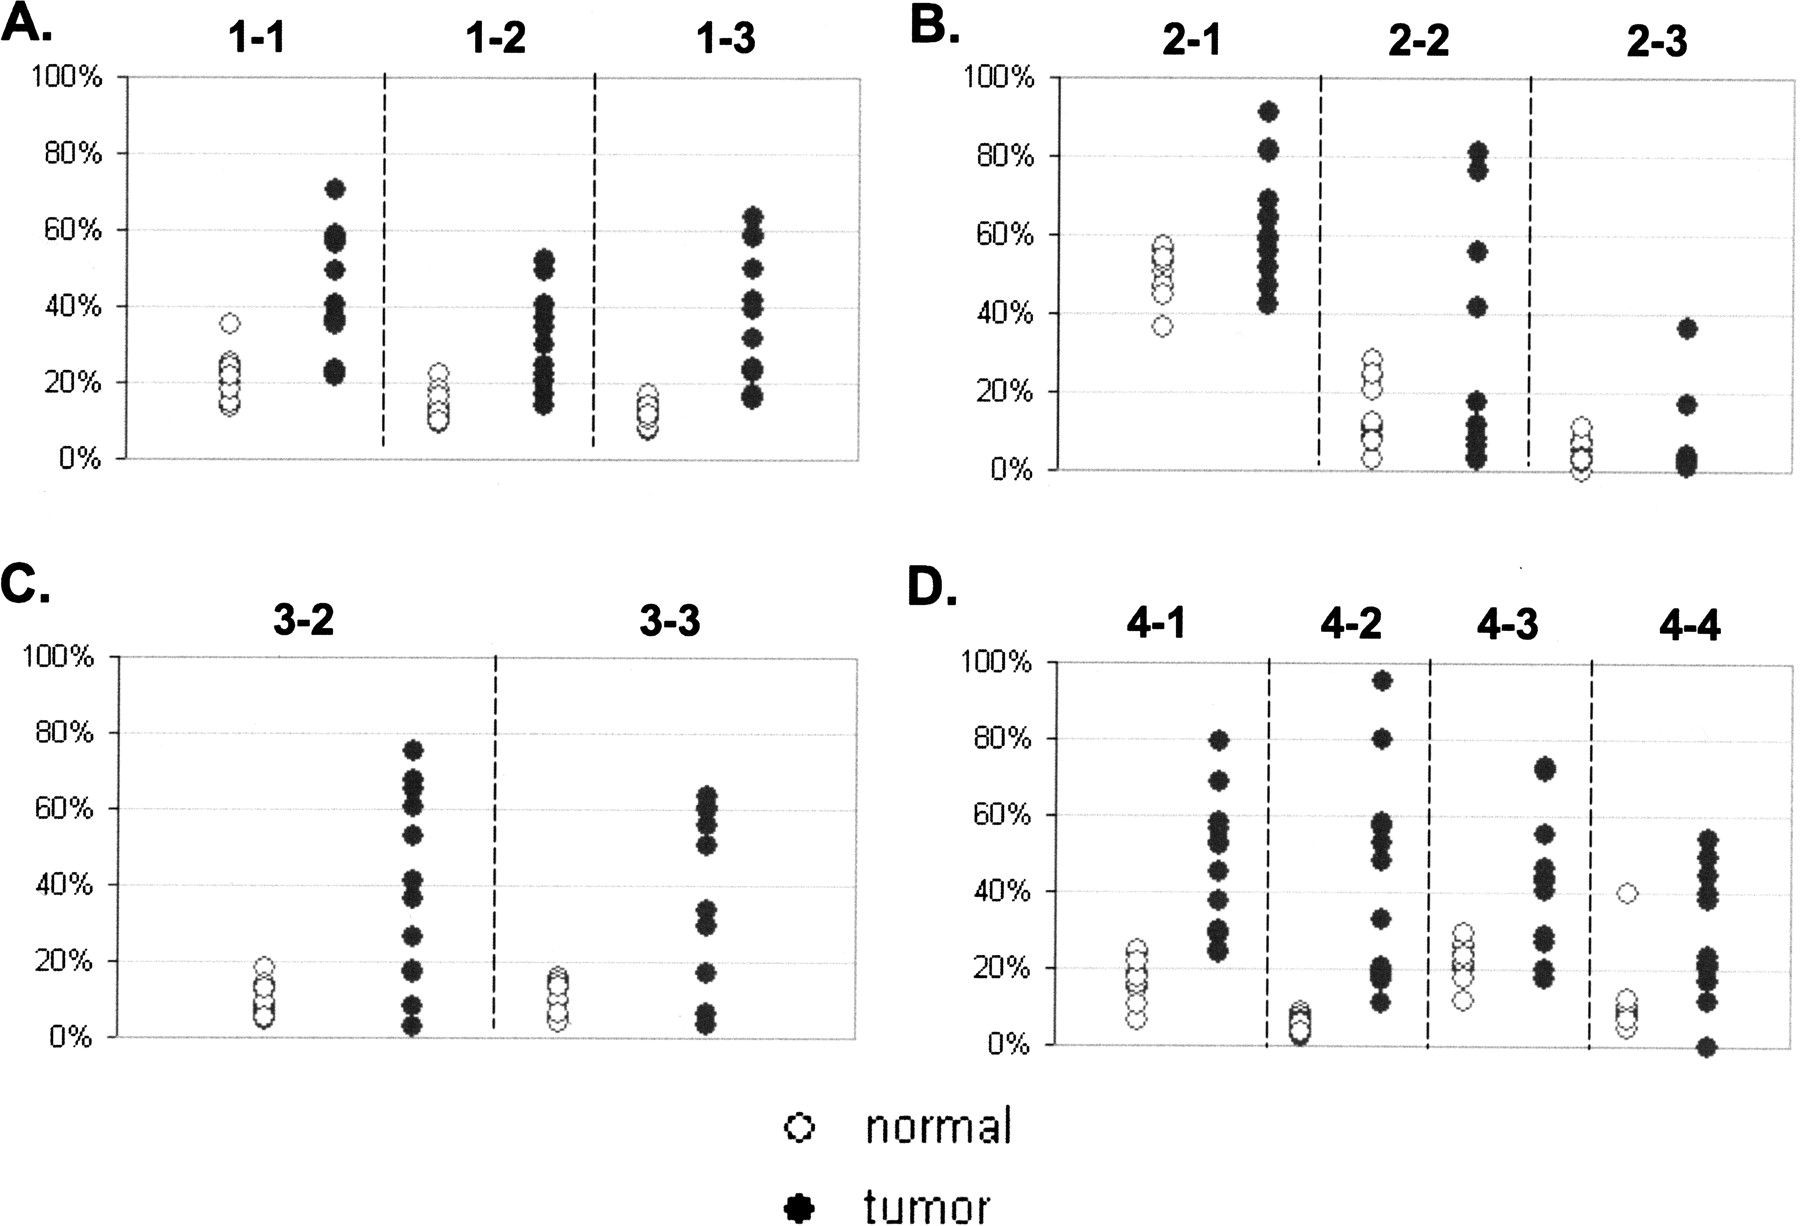
Figure 3.
Methylation density in tissue samples. The plots represent an average methylation density in tissue samples for loci GHSR (A), MGA (B), NFX1 (C), and ha1g_00644 (D). Y axis represents average methylation density. The dashed lines separate data obtained from the different amplicons. The numbers on the top of each plot indicate the amplicons that were used to generate the data beneath. (◦) Normal samples; (●) tumor samples.


