
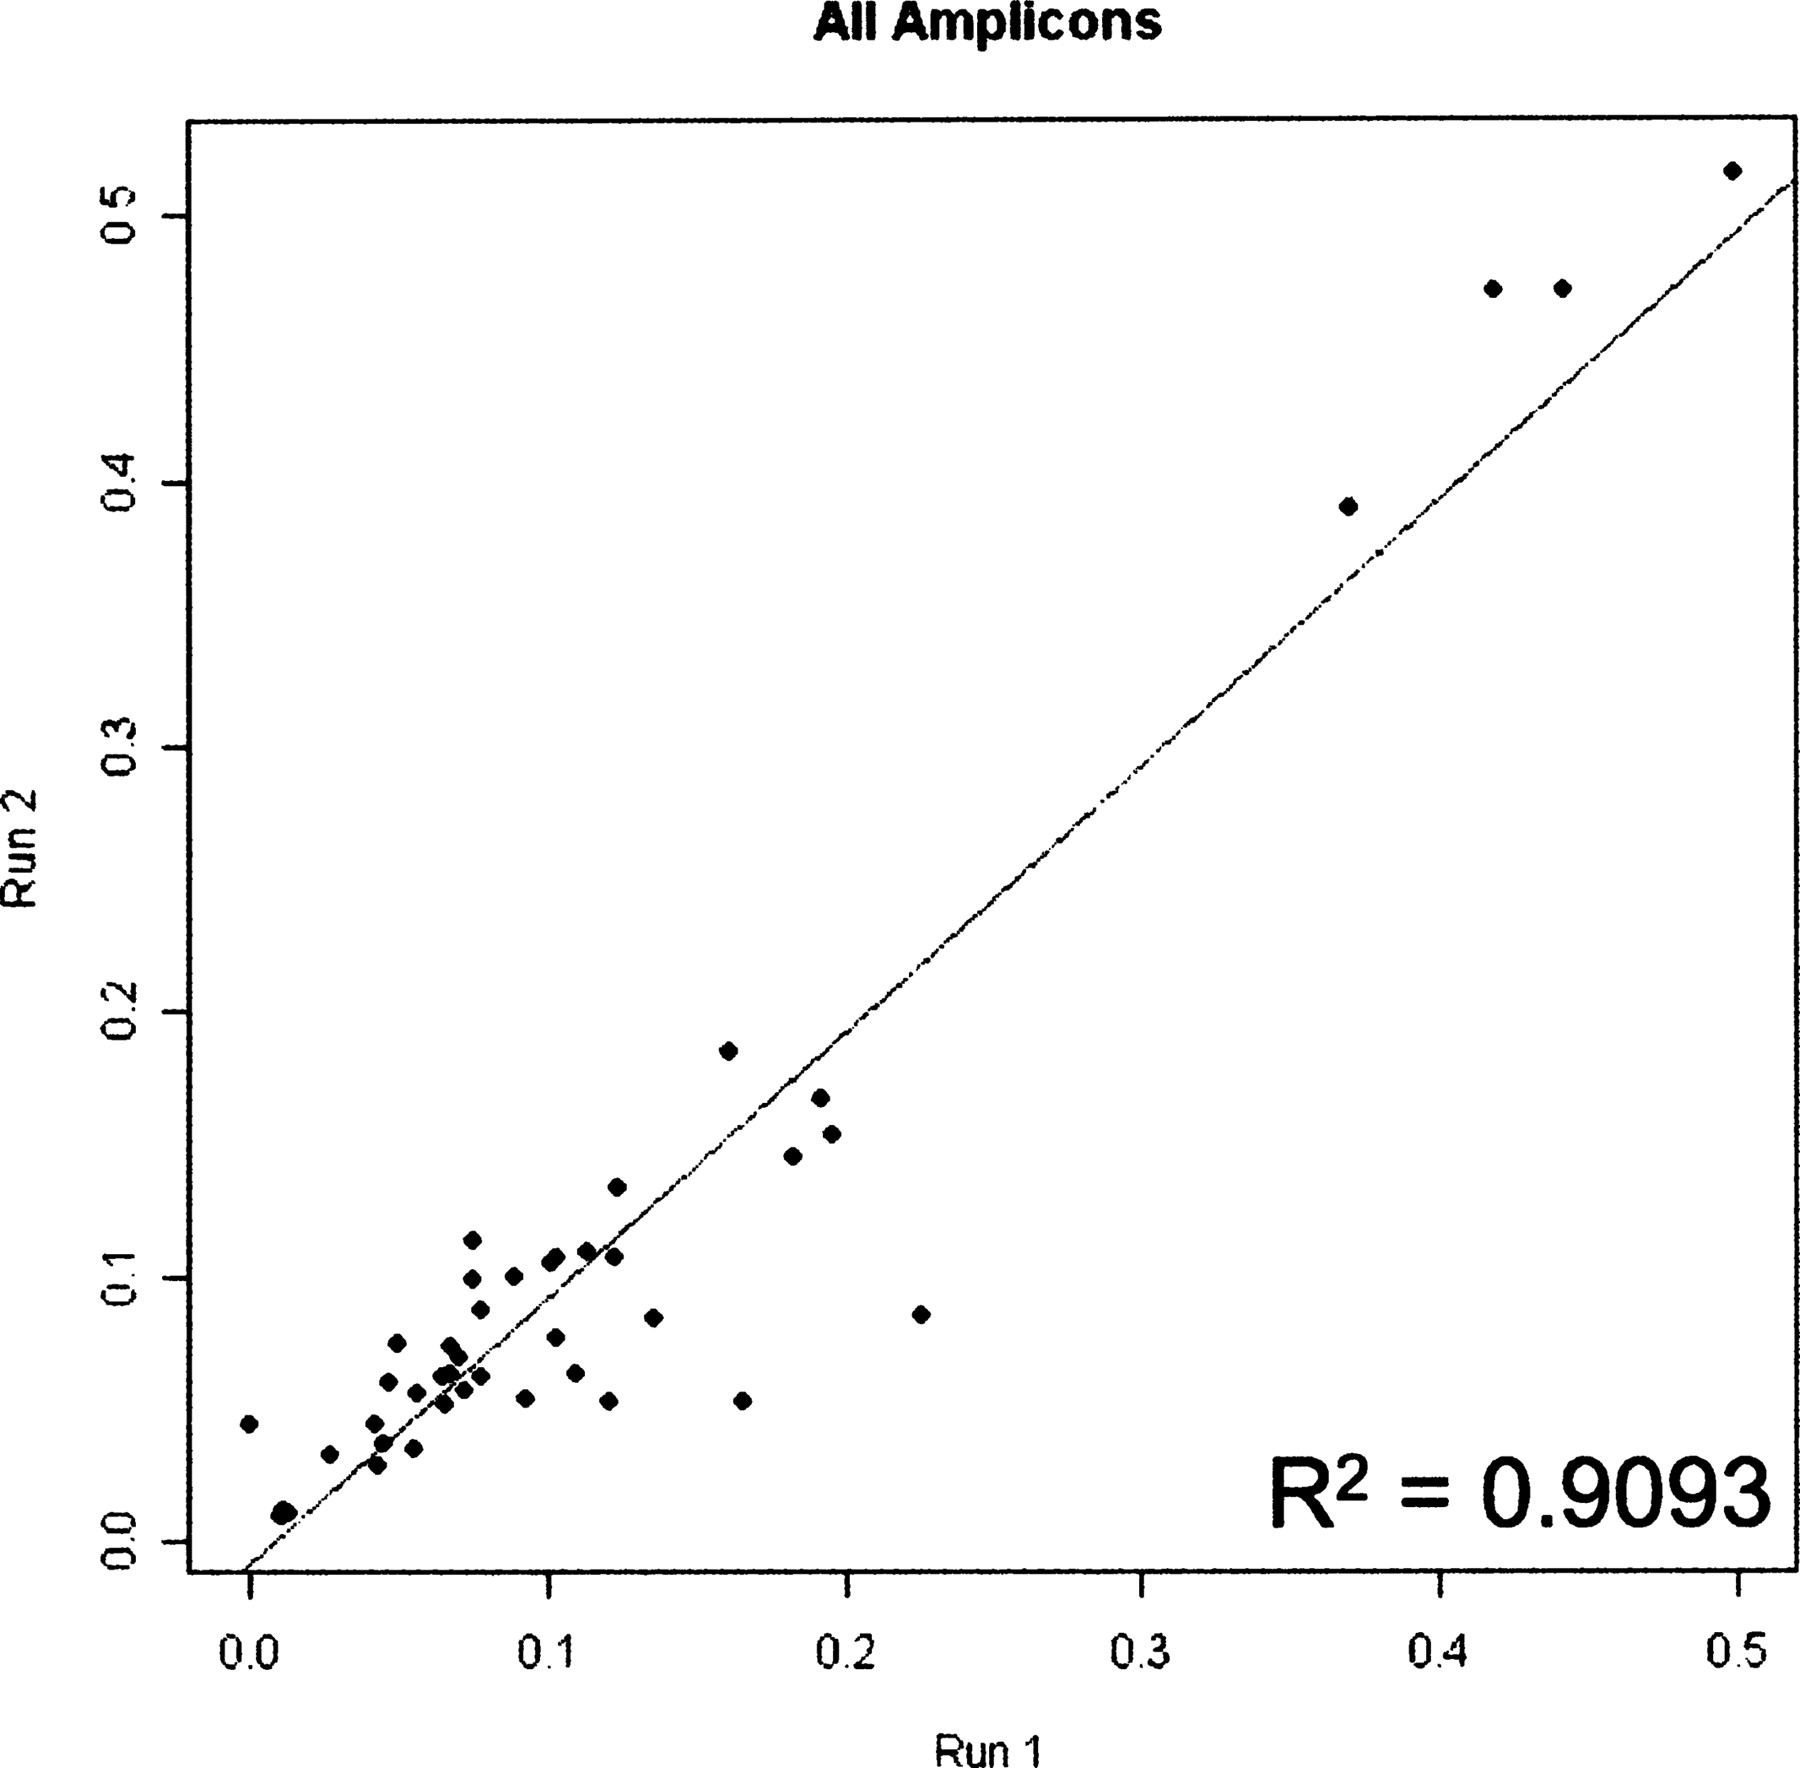
Figure 2.
Reproducibility of massively parallel bisulphite-pyrosequencing. A scatter plot depicts 44 data points, representing the average methylation density of the regions in four samples established in two independent experiments. X axis represents the average methylation density determined in experiment 1; Y axis represents the average methylation density determined in experiment 2. The line (y = 1.0071x−0.0096) indicates the linear regression. The fit to the line is displayed by the R2 term. Note that the slope is very close to 1, indicating that data from two experiments are very similar to each other.


