
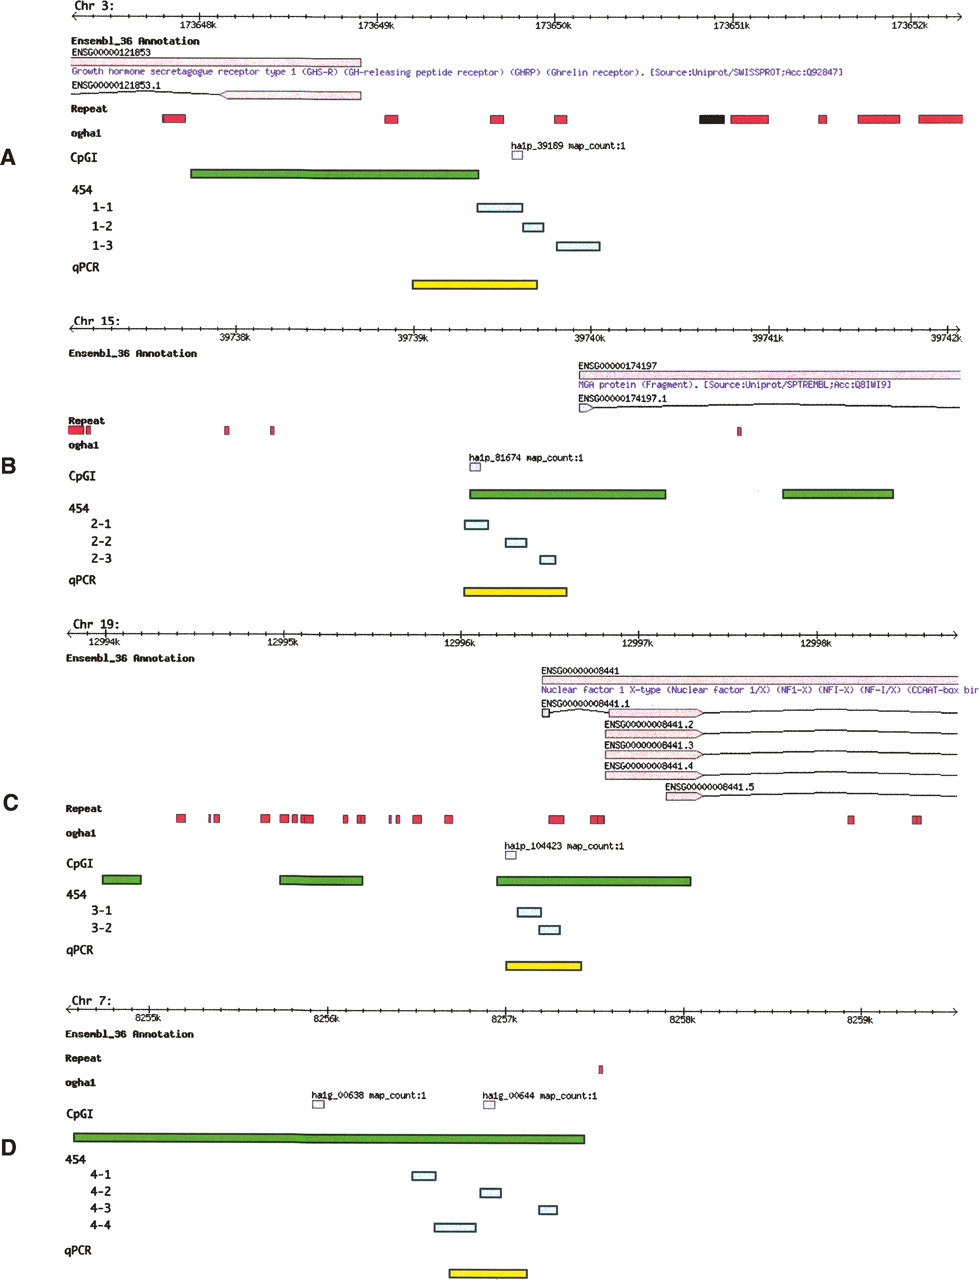
Location and annotation of genomic loci under study. The figure depicts genomic browser views of four loci: (A) GHSR locus, (B) MGA locus, (C) NF1X locus, and (D) an unannotated region on Chr 7.Within each panel are six data tracks: ENSEMBL_36, Repeat, ogha1, CpGI, 454, and qPCR methylation assay. The black line represents 10 Kb of genomic sequence, tick marks indicate 100-bp intervals. Each chromosome is indicated in the top, left of each panel. Top tan boxes (first data track) show protein-coding genes (according to the ENSEMBL_36) with ENSEMBL GeneIDs, along with recognized gene names (blue text). Arrows point in the direction of transcription. Gene models reflect the exon structure as bottom tan boxes connected by black lines (introns). ENSEMBL transcript IDs are also indicated. Recognized repeats and low-complexity regions are indicated with red boxes (second data track). Gray boxes denote the position of the microarray 60 mer utilized to discover the putative breast cancer biomarkers (Ordway et al. 2007) (third track). Green boxes denote the position of Takai and Jones-predicted CpG Islands in the fourth track. The settings used to map the CpGI were G+C 55, O/E 0.60, and a min length of 200 bp. Within the fifth track, aqua boxes denote the position of the sequencing amplicons used in the 454 experiment. The last track (yellow boxes) indicate the position of the qPCR assay used to establish the methylation status of the biomarkers (Ordway et al. 2007).


