
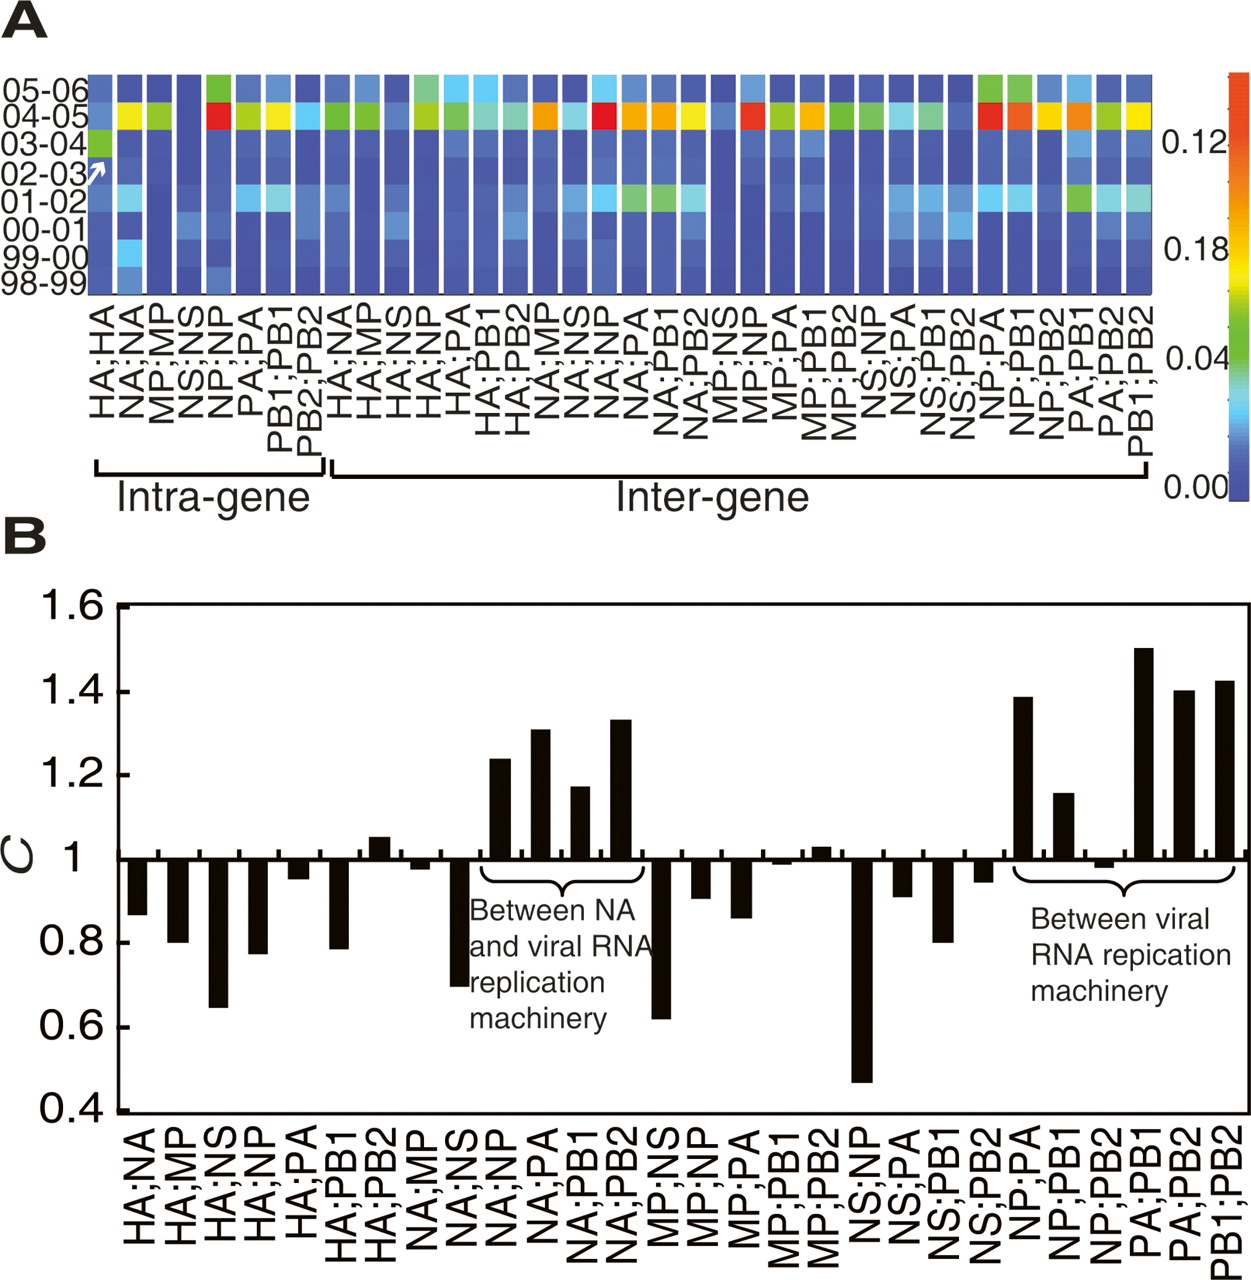
Figure 4.
Quantification of correlated changes between H3N2 gene segments between 1998 and 2006. (A) Heat map of the rates (R) of season-to-season intragenic (left panel) and intergenic (right panel) connection changes for the simulated sampling of H3N2 strains from 1998 to 2006. Significant intragenic HA change is labeled with an arrow. See Methods for detailed calculations. (B) The extent of cooperative changes (C) between gene segments for the simulated sampling of H3N2 strains from 1998 to 2006. See Methods for detailed calculations.


