
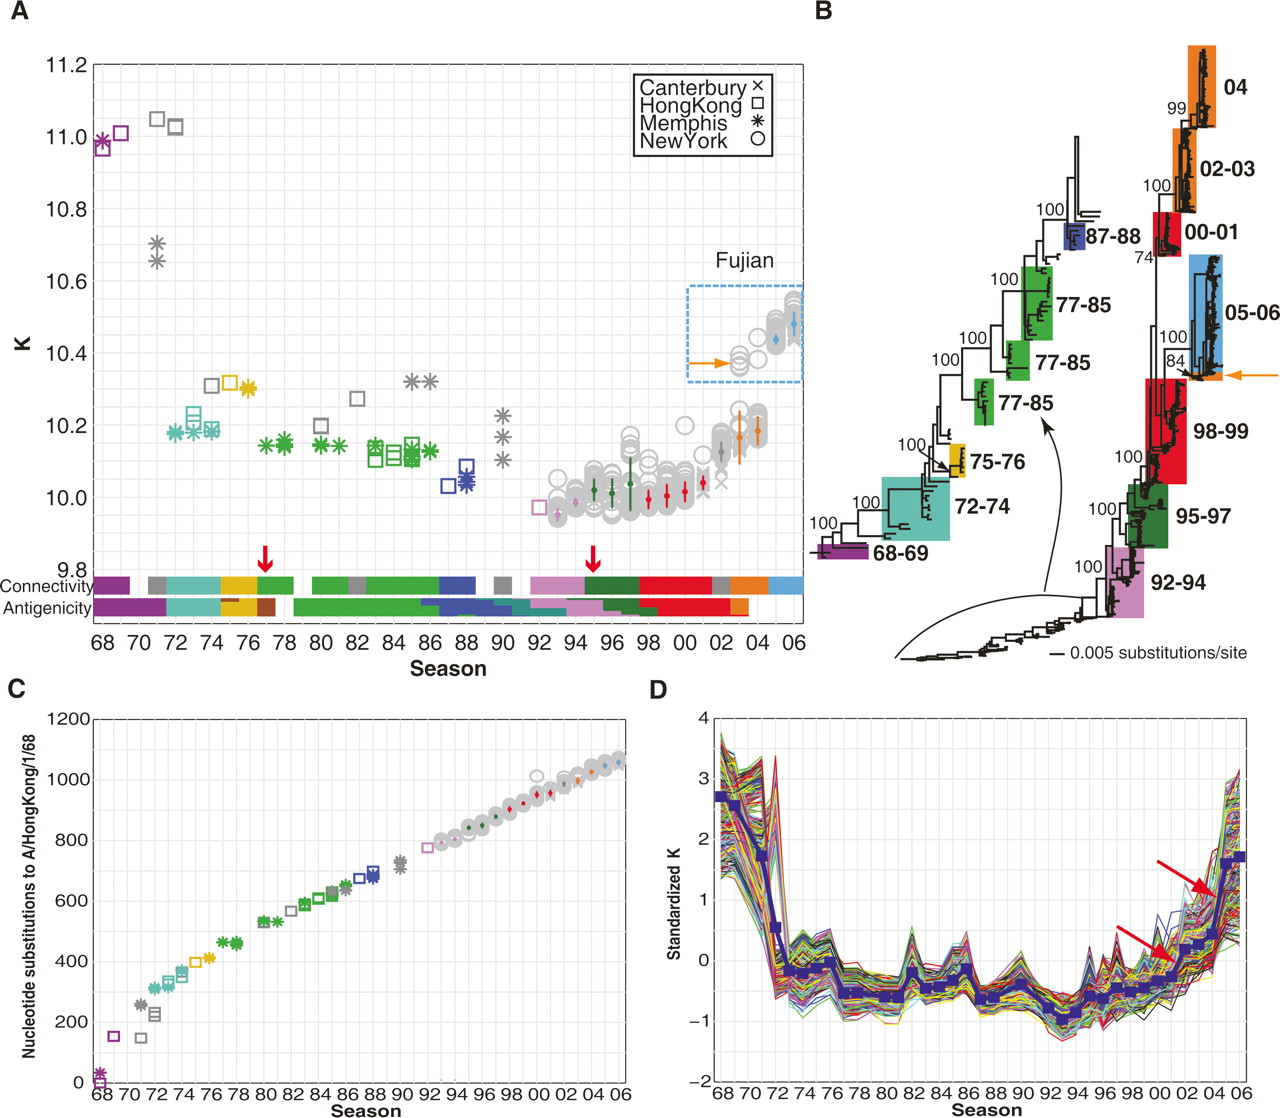
Evolving network connectivity of human influenza virus strains. (A) The average vertex connectivities (K) for each of the 1032 H3N2 nucleotide co-occurrence networks were calculated and plotted by flu season. Each marker represents one strain’s nucleotide co-occurrence network isolated from New York (circles), Memphis (asterisks), Hong Kong (squares), or Canterbury (crosses). The connectivity clusters for predominant strains (see Methods for detailed explanation of calculations) are colored according to their best-matched antigenic clusters in Smith et al’s analysis (Smith et al. 2004). The title denoted “Antigenicity” indicates the color-coded antigenic clusters in Smith’s work. (B) Phylogenetic tree derived from the concatenated viral genomes of H3N2 strains isolated between 1968 and 2006. Bootstrap values are shown for key nodes. The strains within a connectivity cluster in A are mapped to the phylogenetic tree and are shaded with the same color as the connectivity clusters. The clades are labeled using the season from which the majority of the strains were isolated. (C) Season-by-season analysis of whole-genome sequence evolution of 1032 strains. Genetic (nucleotide substitution) distances relative to A/Hong Kong/1/68 were calculated from the phylogenetic tree in B for each of the 1032 strains. The color and symbol representation are the same as in A. (D) Standardized vertex connectivities (K) for the simulated sampling of nucleotide co-occurrence networks are plotted by season. The blue line indicates the average K for all strains sampled from that season.


