
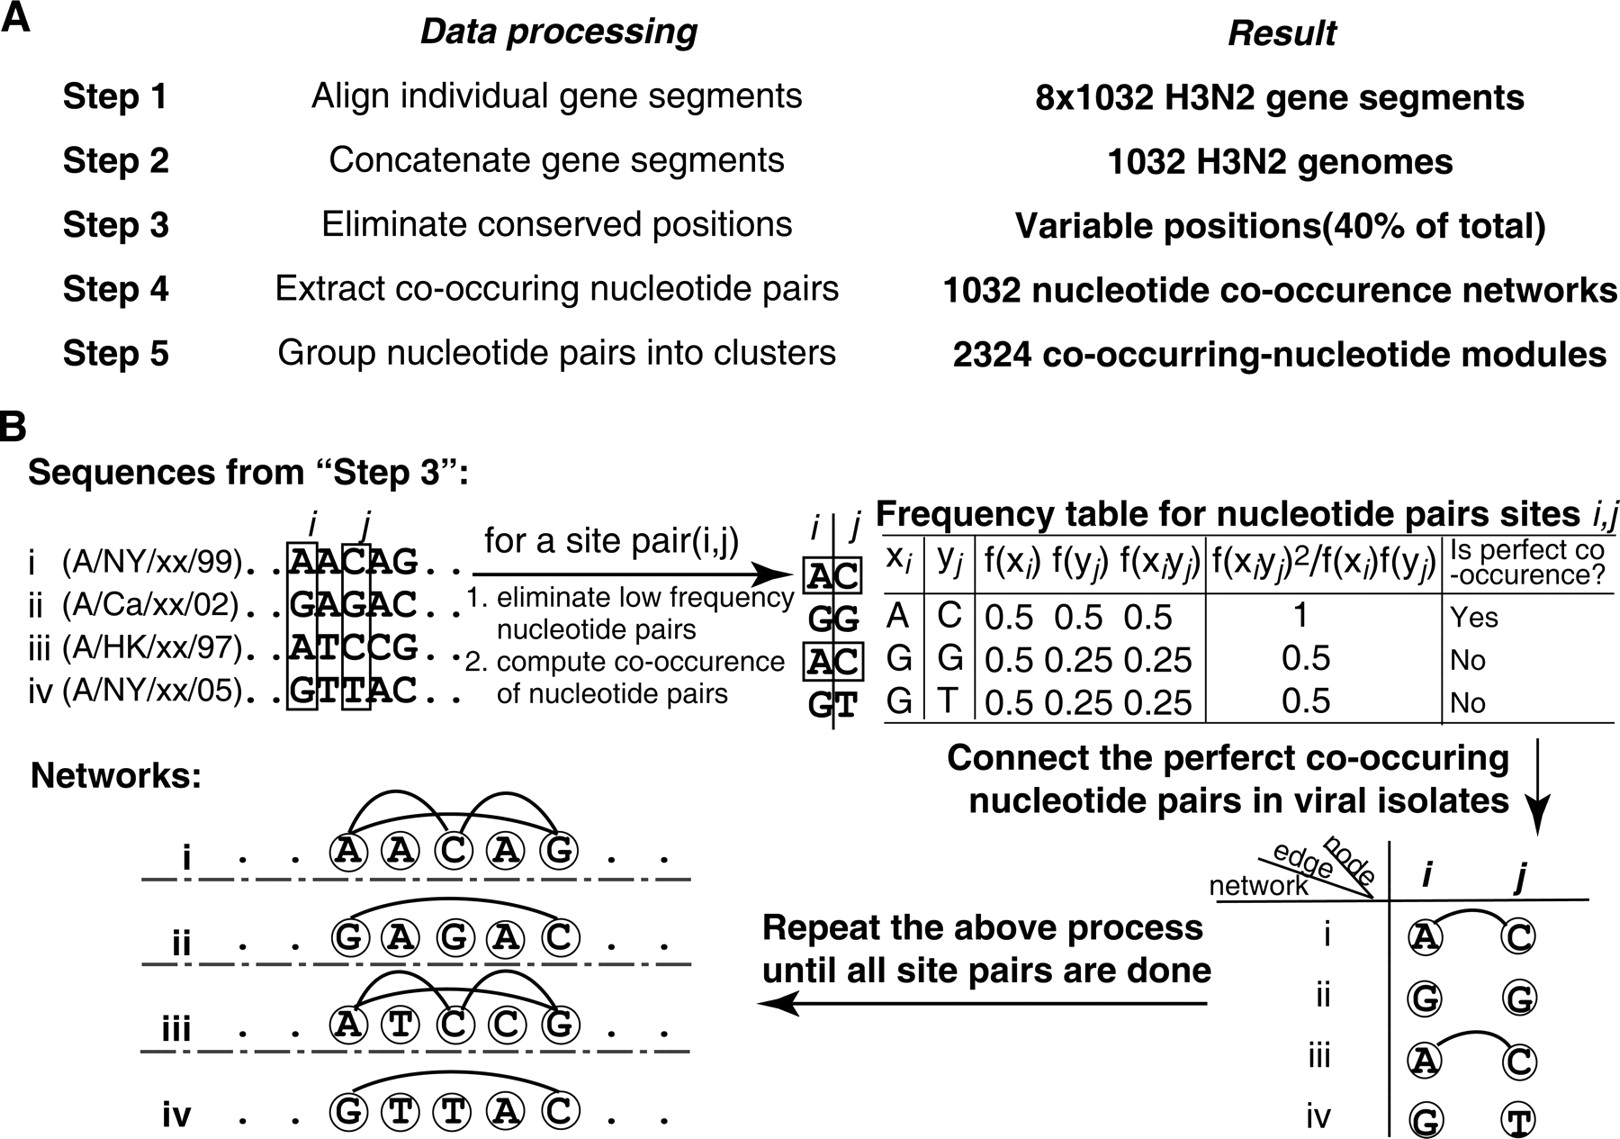
Figure 1.
Overview of network construction. (A) Flow diagram showing the computational processes of analyzing H3N2 virus genomic co-occurrence network. (B) Mathematical framework of Step 4, construction of the viral genomic co-occurrence network. See Methods for details.


