
Table 2.
Consistency between libraries
Click on table to view larger version.
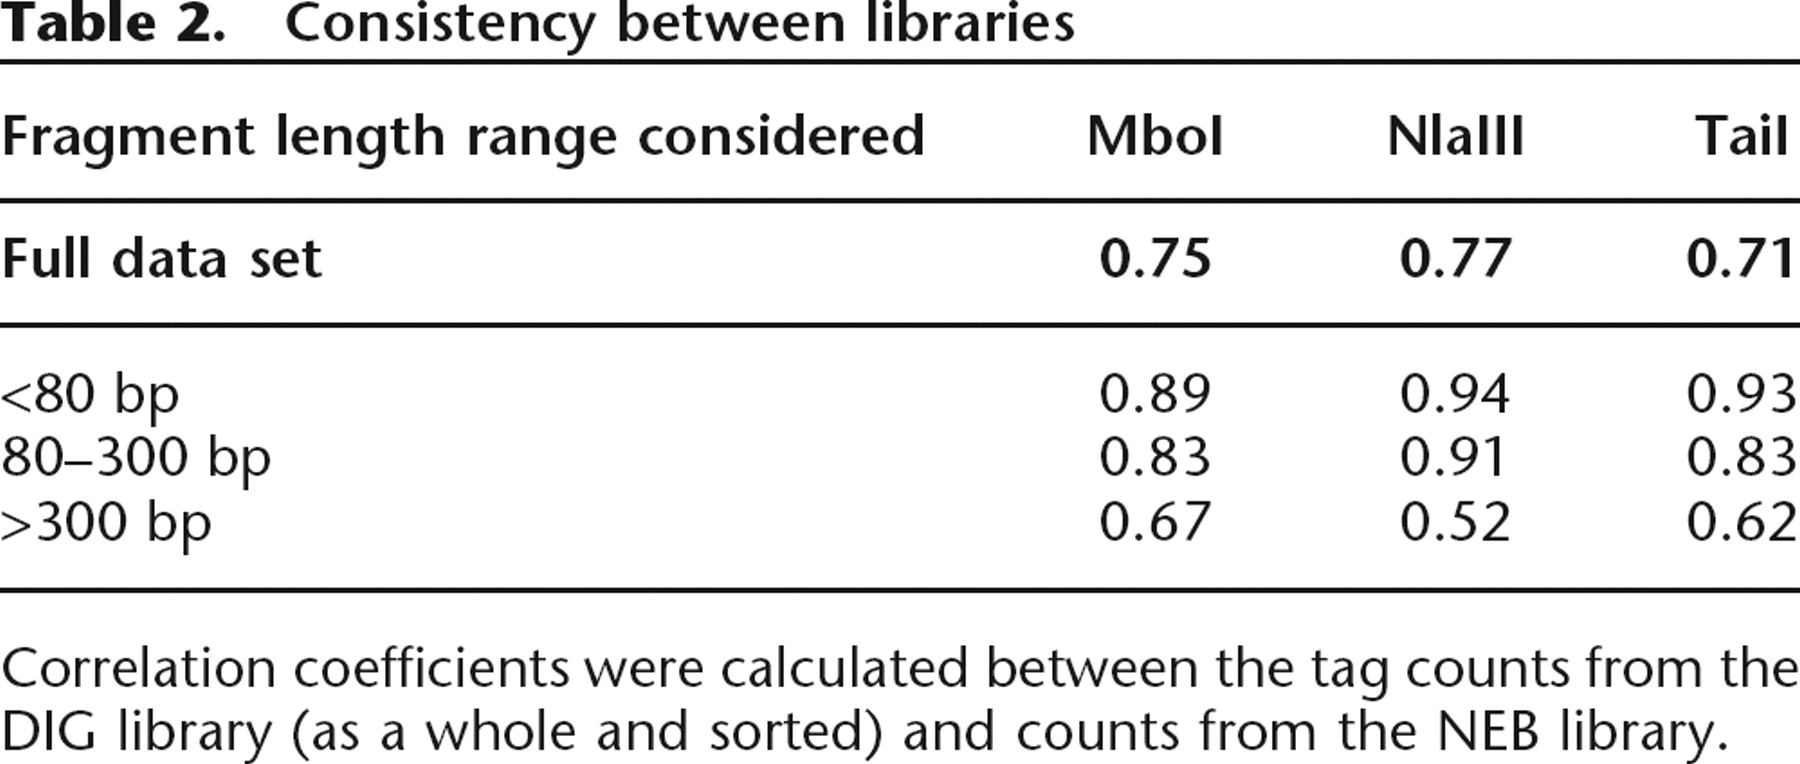
Correlation coefficients were calculated between the tag counts from the DIG library (as a whole and sorted) and counts from the NEB library.


