
Table 1.
Summary statistics for 454-ESTs sequencing and mapping to D. melanogaster genomes and annotated transcripts (release 5.1)
Click on table to view larger version.
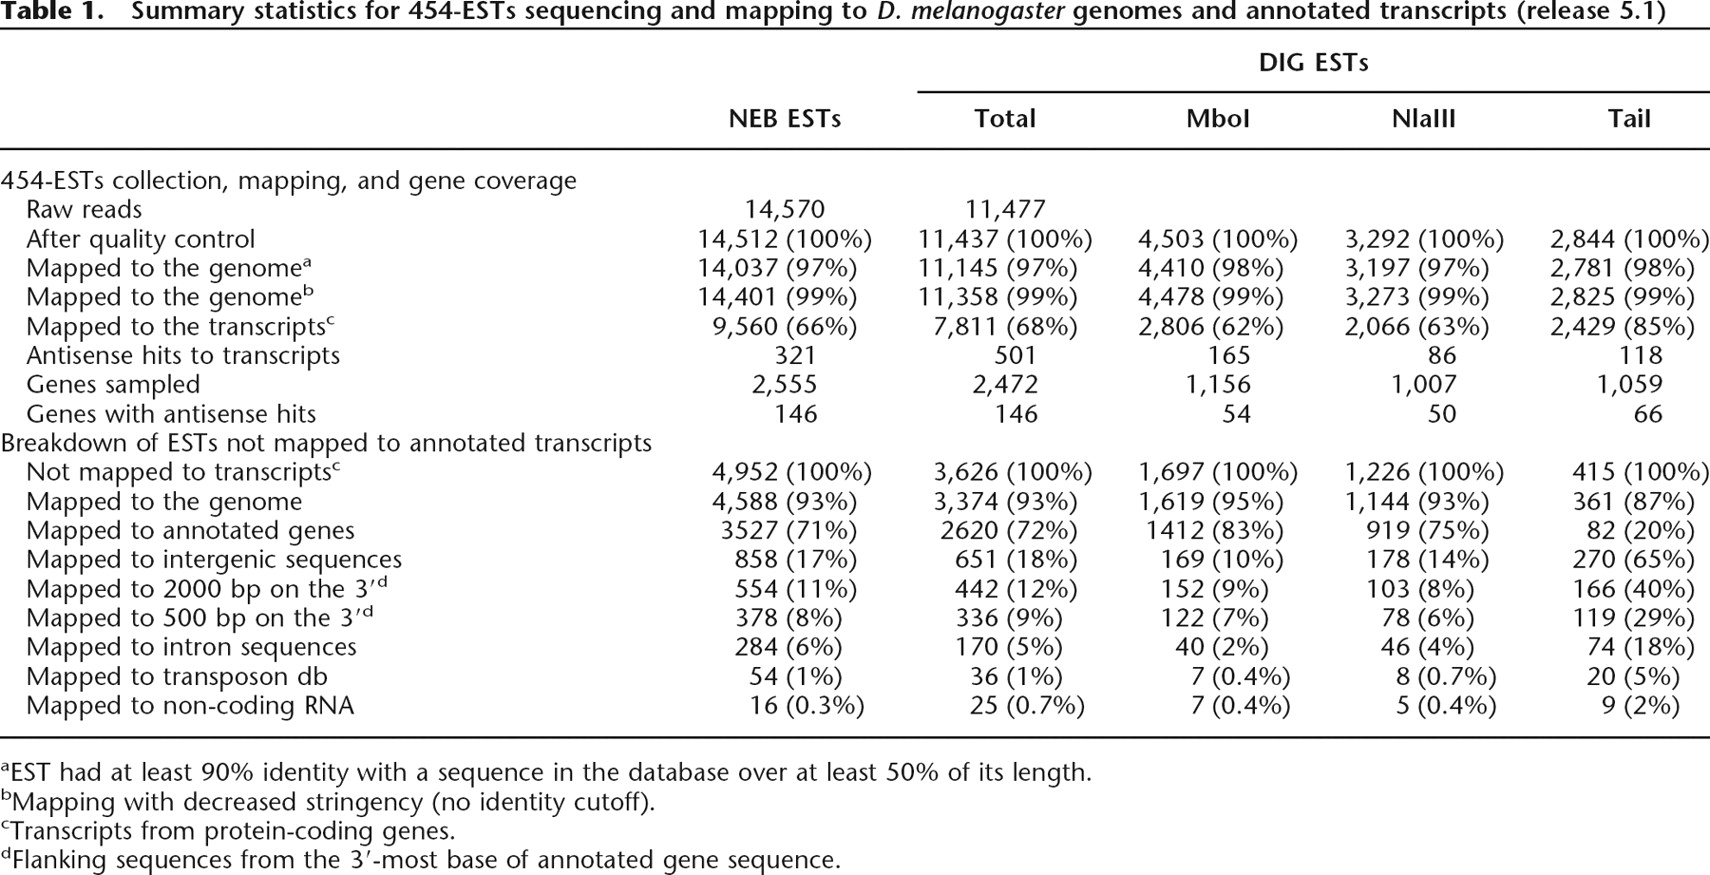
aEST had at least 90% identity with a sequence in the database over at least 50% of its length.
bMapping with decreased stringency (no identity cutoff).
cTranscripts from protein-coding genes.
dFlanking sequences from the 3′-most base of annotated gene sequence.


