
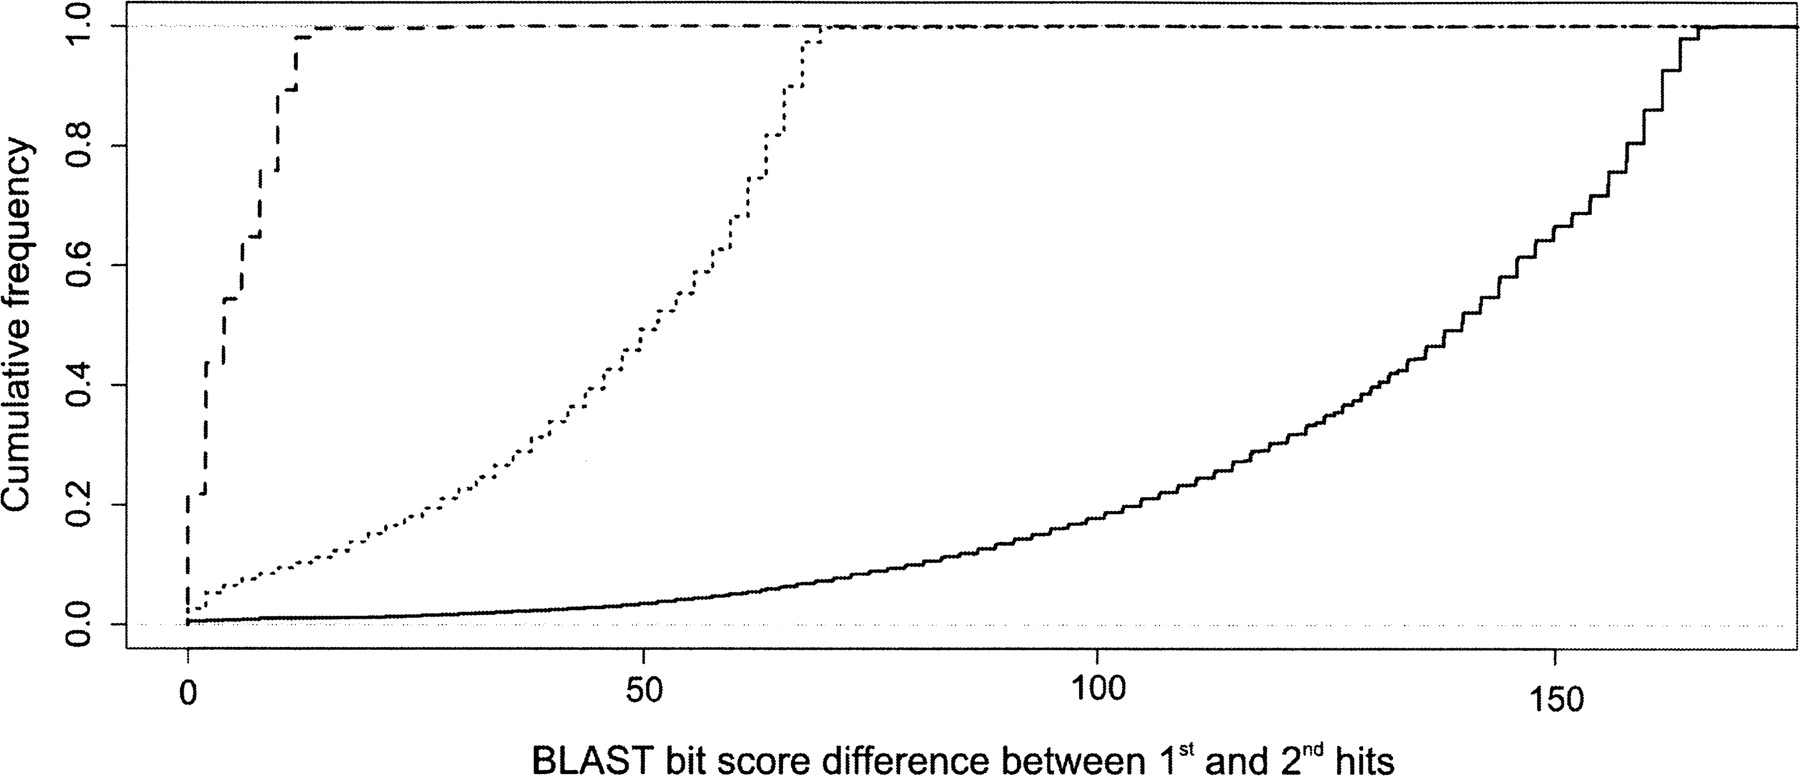
Figure 4.
Cumulative distribution of the difference in BLAST bit scores of the best and second-best hits. The dashed, dotted, and solid lines show the cumulative distribution of 20, 50, and 100 bp, respectively. The plots are based on the 454 sequencing reads that provided at least 100 bp sequence. The BLAST searches were performed by using the 5′-most 20, 50, and 100 bp. The BLAST search was performed against the D. melanogaster genomic sequence without filtering regions of low complexity.


