
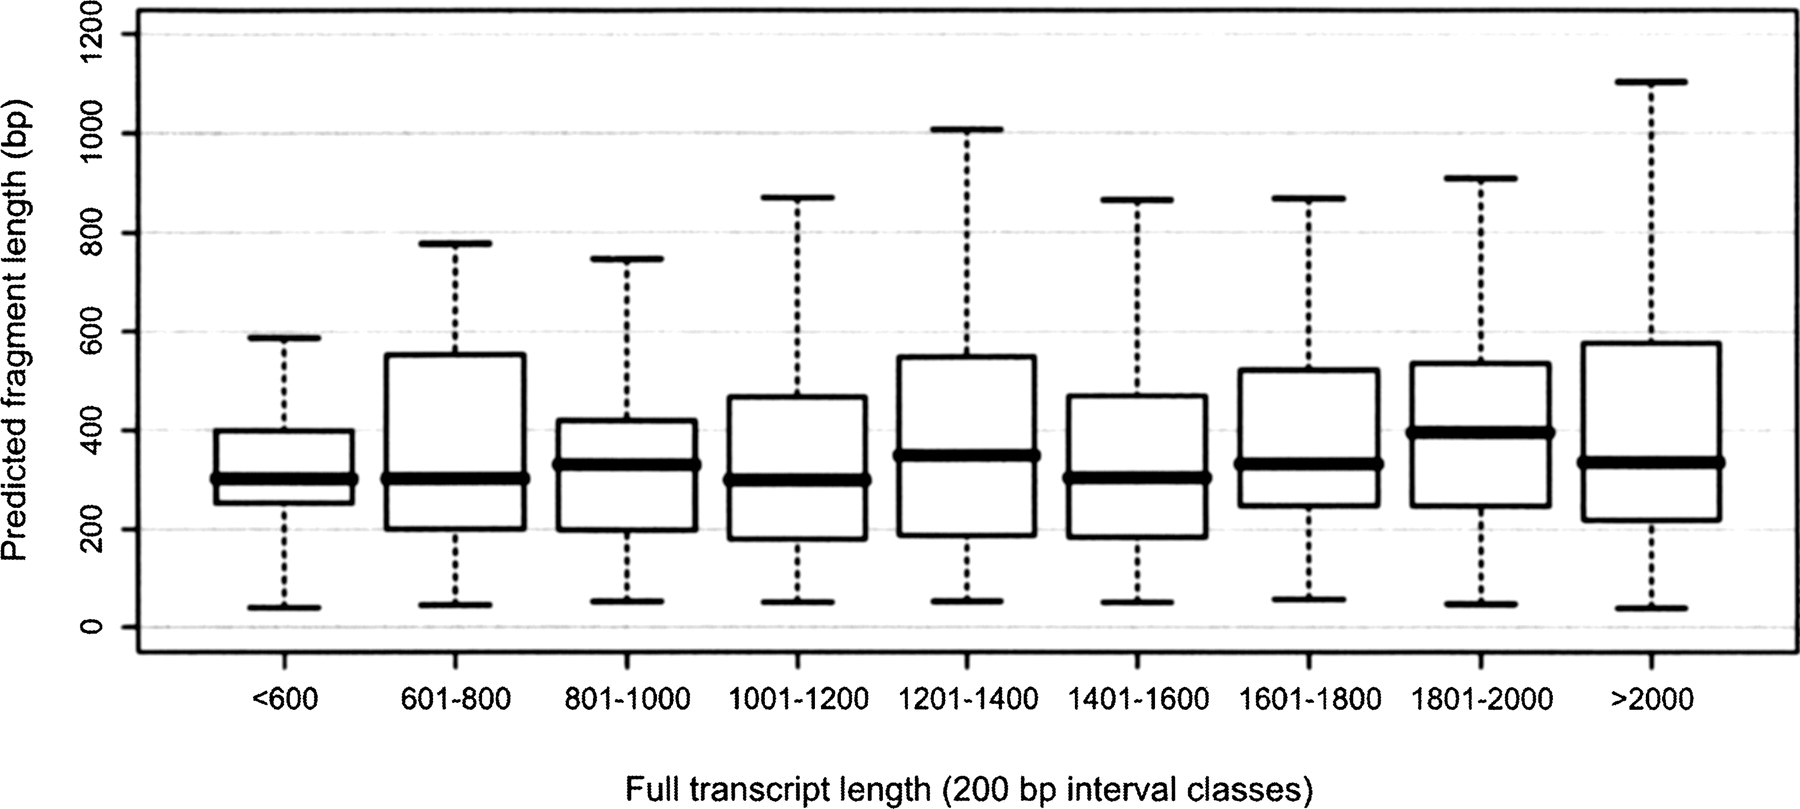
Figure 3.
Length distribution of 3′ cDNA fragments after nebulization among different size classes of full-length transcripts (as inferred from the available genome annotation). The bold line indicates the median. The lower hinge gives the 25% quantile, and the upper hinge the 75% quantile. Whiskers (dashed lines) extend to the maximum and minimum sizes. Outliers are not shown.


